Mac Memory Pressure Explained: Yellow, Red, and Swap
Open Activity Monitor, click Memory, and the first number most people look at is Memory Used. It is nearly always high. On a 48 GB Mac it will happily sit at 40 GB with a browser and an editor open, which looks like a problem to solve.
It rarely is. macOS uses the RAM you paid for, because unused memory does nothing: the system fills it with file caches and keeps recently used pages resident. Whether the Mac is actually short of memory shows up in the Memory Pressure graph at the bottom of that same window, which usually sits green while "Memory Used" looks alarming.
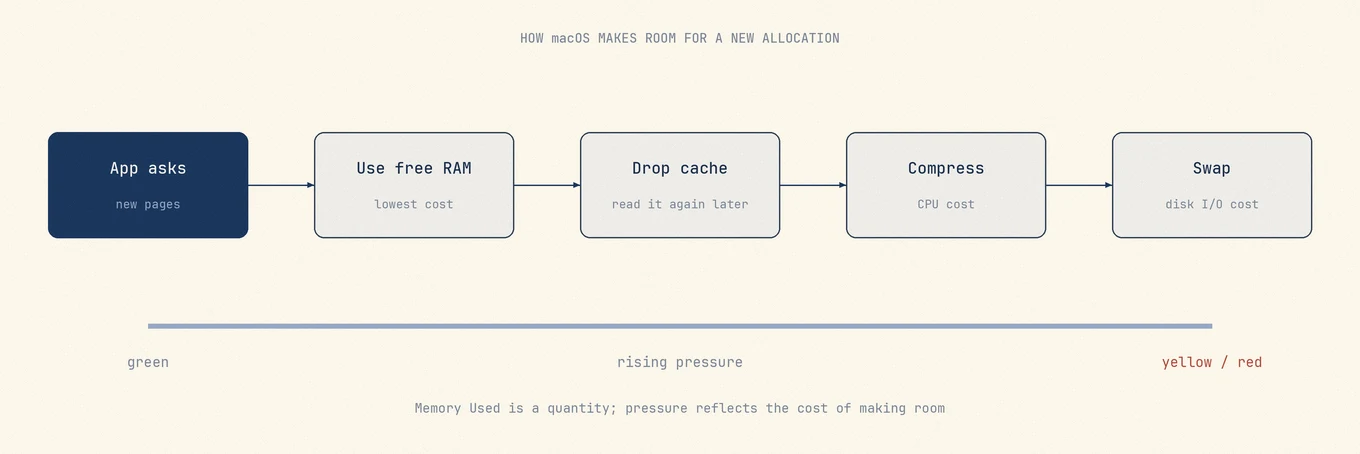
Ignore "Memory Used" and read the Memory Pressure graph. If it is green, a nearly full RAM meter is not a problem and there is nothing to fix. If it is yellow or red, the three counters below tell you why.
Why "Memory Used" is the wrong number
macOS treats free RAM as wasted RAM. Pages that hold recently read files stay resident because reading them again from RAM is free and reading them again from disk is not. The moment an app needs that memory, the cache is dropped.
Apple's Activity Monitor memory guide shows the allocation in the Memory tab:
| Row | What it is | Should it worry you |
|---|---|---|
| App Memory | Pages apps have allocated and are using | Only if one app is far out of line |
| Wired Memory | Pages the kernel cannot page out | Rarely actionable |
| Compressed | Pages squeezed to make room, still in RAM | A little is normal, a lot is a signal |
| Cached Files | File data kept because RAM was free | Never; this is the system working |
Memory Used covers App Memory, Wired Memory, and Compressed memory. Cached Files is reported separately: it occupies otherwise unused RAM and can be overwritten when the system needs it. A healthy Mac can therefore show substantial Memory Used and substantial Cached Files at the same time without being short of RAM.
Read pressure instead
The Memory Pressure graph is macOS's own summary of whether it can satisfy allocations without hurting performance:
- Green. Requests are being met from free or reclaimable memory. Nothing to do, at any level of "Memory Used".
- Yellow. The system is compressing and evicting to keep up. Still working, but the headroom is gone and a large new allocation will cost you.
- Red. Allocations are waiting on memory that has to be freed first. The beachball and the slow app switch come from here.
You can also read it from the command line:
memory_pressure
The interesting line is the last one:
System-wide memory free percentage: 74%
The same command prints the raw counters it derives that from, including page counts and swap activity, which is useful when you want evidence rather than a colour.
The three signals behind the colour
When pressure is yellow or red, three numbers explain why. Read them together, because any one of them alone can mislead.
Swap used. This is memory that has been written out to disk because it did not fit.
sysctl vm.swapusage
vm.swapusage: total = 6144.00M used = 4568.19M free = 1575.81M (encrypted)
Swap being non-zero is not itself a failure. macOS swaps out pages that have not been touched in a long time even when memory is comfortable, and on an SSD the cost of doing so is small. Swap that is large and growing while you work is the real signal.
Compression activity. Before swapping to disk, macOS compresses pages in RAM.
vm_stat | grep -i compress
Pages stored in compressor:                  1945157.
Pages occupied by compressor:                 389440.
Decompressions:                             82848340.
Compressions:                              163587315.
Compressions climbing quickly while you use the Mac means the system is fighting for room. A large historical total on a machine that has been up for weeks means nothing on its own.
Page-ins under load. Reading pages back from disk is what you feel as a stall. A Mac that is compressing, swapping, and paging in at the same time is the classic beachball state.
Finding the app responsible
Sort Activity Monitor's Memory tab by the Memory column and look at the top few rows rather than the whole list. The answer is usually one of four things:
- A browser with many tabs. Each renderer is a separate process, so the browser's total is spread across rows. Chrome's own Task Manager, under Window, attributes memory to individual tabs and extensions. See Chrome Helper high CPU and memory.
- A virtual machine or container runtime. These reserve memory up front, so the number is a configuration choice rather than a leak.
- A long-running creative or development app. Memory that grows steadily across a session and never comes back down is worth reporting to the developer.
- An unfamiliar process. Identify it before killing it; see how to investigate unfamiliar processes.
Quit the app. Force quitting a process that is merely large, while the system is coping, costs you unsaved work and gains nothing.
What does not help
- Memory cleaner apps. Freeing memory means dropping caches the system built on purpose. The RAM meter looks better and the Mac gets slower while everything is read back in.
sudo purgeon a schedule. It flushes file caches for benchmarking, the same mistake in command form. It also has nothing to do with disk purgeable space, despite the shared name; see purgeable space.- Closing apps you are about to reopen. macOS decides which idle apps to compress better than a routine does.
- Disabling swap. Swap is the safety valve. Remove it and an app gets killed instead.
When the answer really is more RAM
Apple Silicon uses unified memory that cannot be upgraded after purchase, so it pays to diagnose this rather than guess.
Buy more memory when pressure sits yellow or red during your ordinary work, swap grows steadily through a session, and the top consumers are all things you need open at once. If pressure is green and you were only reacting to "Memory Used", more RAM would change nothing you can perceive.
Where a monitor fits
Mole shows memory pressure alongside CPU, thermals, and the processes driving them, so a slow Mac can be attributed in one place rather than across four windows. It reports pressure prominently because it helps explain how the Mac feels. Status and the menu bar monitor memory without clearing it. Optimize has a separate memory-release task that runs only when macOS reports warning or critical pressure; normal pressure skips it.
FAQ
Is high memory usage bad on a Mac?
No. High usage with green pressure is macOS using available RAM for caching, which is the intended behaviour. Pressure is the health indicator, not usage.
How much swap is too much?
There is no threshold that holds across machines. Look at the trend during your actual work rather than the absolute figure: swap that grows steadily while pressure is yellow or red is the problem, and a few gigabytes on a machine that has been awake for weeks usually is not.
Do memory cleaner apps work?
They do what they advertise, which is the problem. Dropping caches makes the free-memory number rise and makes the next few minutes slower. macOS already reclaims memory when something needs it.
Why is my Mac slow when pressure is green?
Then memory is not the constraint. Look at CPU, thermal throttling, or disk. Start with why your Mac is slow, which works through the bottlenecks in order.