Which App Is Using My Network on Mac?

Something is using the connection. The Wi-Fi indicator is busy while you are not doing anything, a tethered connection burns through its allowance in an afternoon, or a video call degrades every time you sit down to work. macOS can answer this, but the tools are scattered and the most prominent number in each of them is cumulative rather than live, which sends people to the wrong process.
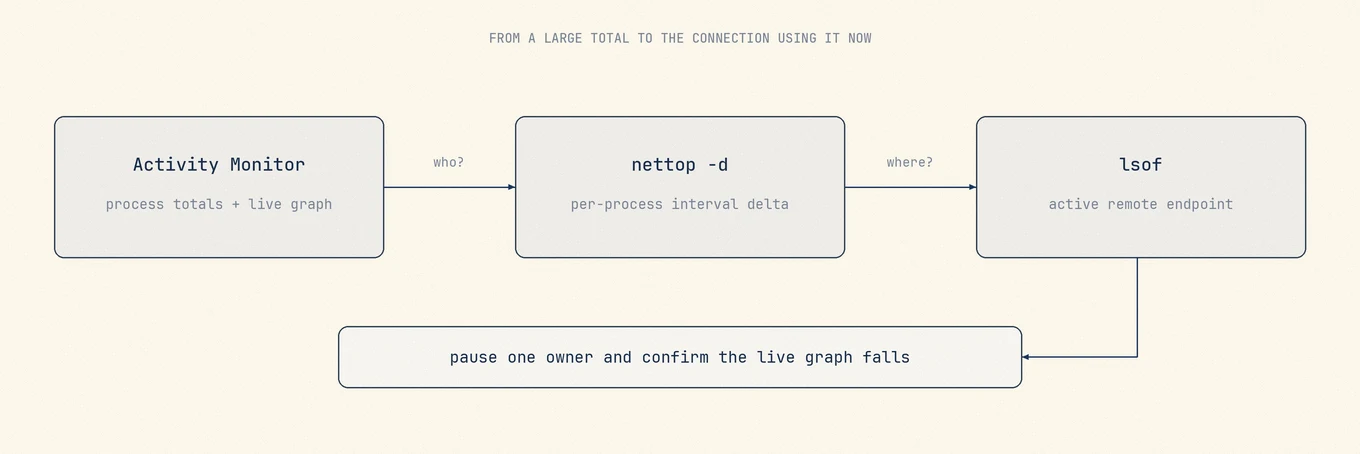
Activity Monitor's Network tab names the process, but its columns count
totals since each process started. For what is moving data right now, use nettop. For
which remote hosts a process is talking to, use lsof -i.
Activity Monitor names the process
Open Activity Monitor and select the Network tab. Every process that has moved data appears with bytes sent and received. Apple's Activity Monitor guide distinguishes cumulative Data received/sent from live Data received/sent per second at the bottom of the window.
Sorting those columns is what sends people after the wrong process. They are totals accumulated since each process launched, so a daemon running since your last reboot outranks the app saturating your link this minute. Sorting by "Rcvd Bytes" can therefore put a process with little current traffic at the top.
Two rows alarm people and usually should not:
- mDNSResponder handles DNS and local network discovery for the whole system. On a Mac that has been up for weeks it can show gigabytes. It is a proxy for everything else resolving names, not an app downloading in the background.
- kernel_task appears because network work crosses the kernel. See kernel_task high CPU for the same misattribution in its CPU form.
The bottom of the window has a live graph of data in and out per second. That graph, not the columns, is the thing to watch while you change something.
nettop shows what is moving now
nettop is the tool that answers the real question. It ships with macOS and needs no
installation.
nettop -P -L 2 -d -J bytes_in,bytes_out
,bytes_in,bytes_out,
syslogd.362,0,22701,
apsd.368,685304,414375,
mDNSResponder.480,4189609493,104188210,
-P aggregates per process rather than per connection, -L 2 prints two CSV samples,
-d makes later samples deltas, and -J selects the columns. The first sample is the
baseline; the next one shows what moved during the interval. Run nettop -P -d
interactively when you want the same view to refresh until you quit.
lsof -i shows where it is connecting
Once you have a name, the next question is usually where it is sending data.
lsof -nP -iTCP -sTCP:ESTABLISHED
-n skips reverse DNS and -P skips port-name lookup, which makes the output fast and
literal. -iTCP limits the result to TCP, while -sTCP:ESTABLISHED removes listening and
closed sockets. You get the process, local port, and remote address visible to your user.
Use elevation only when a system-owned process is the missing part of the investigation.
Resolving those addresses is where honesty matters: an IP that belongs to a large cloud provider tells you almost nothing, because most of the internet is hosted there. Treat it as a hint, not an identification.
The usual answers
Before assuming something is wrong, check the things that are supposed to use the network without being asked.
| Cause | How to recognise it | Where to control it |
|---|---|---|
| iCloud Photos sync | Sustained upload after importing photos | Photos > Settings > iCloud |
| iCloud Drive | Activity after large file changes | System Settings > Apple Account > iCloud |
| macOS or App Store updates | softwareupdated, appstoreagent |
System Settings > General > Software Update |
| Third-party sync clients | Dropbox, Google Drive, OneDrive helpers | The app's own preferences |
| Backup software | Long steady upload on a schedule | The backup app |
| A browser tab | Video, a stuck upload, an autoplaying page | Chrome's Task Manager, Safari's Activity window |
Software Update deserves special mention because it downloads in the background by default and a full macOS installer is several gigabytes. On a metered connection that single setting is often the whole problem.
What macOS will not tell you
Three limits, because several popular articles skip them:
- There is no built-in per-app bandwidth history. Activity Monitor and
nettopboth report from process start or from the moment you started watching. Nothing in macOS keeps a per-app record you can consult afterwards. - Per-process totals are not per-app totals. A browser spreads its traffic across renderer processes, and a helper daemon may carry traffic for several apps at once.
- Traffic through a VPN or a system extension may be attributed to the extension rather than to the app that generated it.
A tool claiming a complete historical per-app breakdown is either installing a network filter of its own or estimating, and you want to know which before trusting the number.
A repeatable check
- Watch Activity Monitor's live graph at the bottom of the Network tab, not the columns.
- Run
nettop -P -L 2 -d -J bytes_in,bytes_outand read the second sample. - For the process that grew, run
lsof -nP -iTCP -sTCP:ESTABLISHEDto see where it is connected. - Pause the suspect app or sync service and confirm the graph drops.
- If nothing drops, keep investigating other apps and services, including Software Update and iCloud.
Step four is the one people skip, and it is what separates an identification from a guess.
Where a monitor fits
Mole keeps live network throughput in the menu bar next to CPU, memory, and thermal state, so a busy connection is visible when it happens rather than reconstructed afterwards. It reports the throughput it can measure and does not install a network filter to claim a per-app history macOS does not provide.
FAQ
Why does mDNSResponder use so much data?
It resolves names and handles local network discovery for the entire system, so the traffic of many other processes is counted against it. It is not downloading anything of its own.
Can I see how much data an app used yesterday?
Not from macOS. There is no built-in per-app history. Third-party tools that offer this install a network extension to observe traffic themselves.
How do I find what is using data on a hotspot?
Turn on Low Data Mode for that network in System Settings > Wi-Fi > Details, which stops
several background services including automatic update downloads, then use the nettop
diff above for whatever is left.
Is high network activity a sign of malware?
It is rarely the first sign, and the usual explanations above cover almost every case. Work through them before treating steady background traffic as suspicious.