Mac performance monitor
One live Mac system monitor
Status shows Health, CPU, GPU, memory, battery or temperature, disk, network, and supported fan data in one view. Recent 60-second trends help distinguish a brief spike from sustained activity.
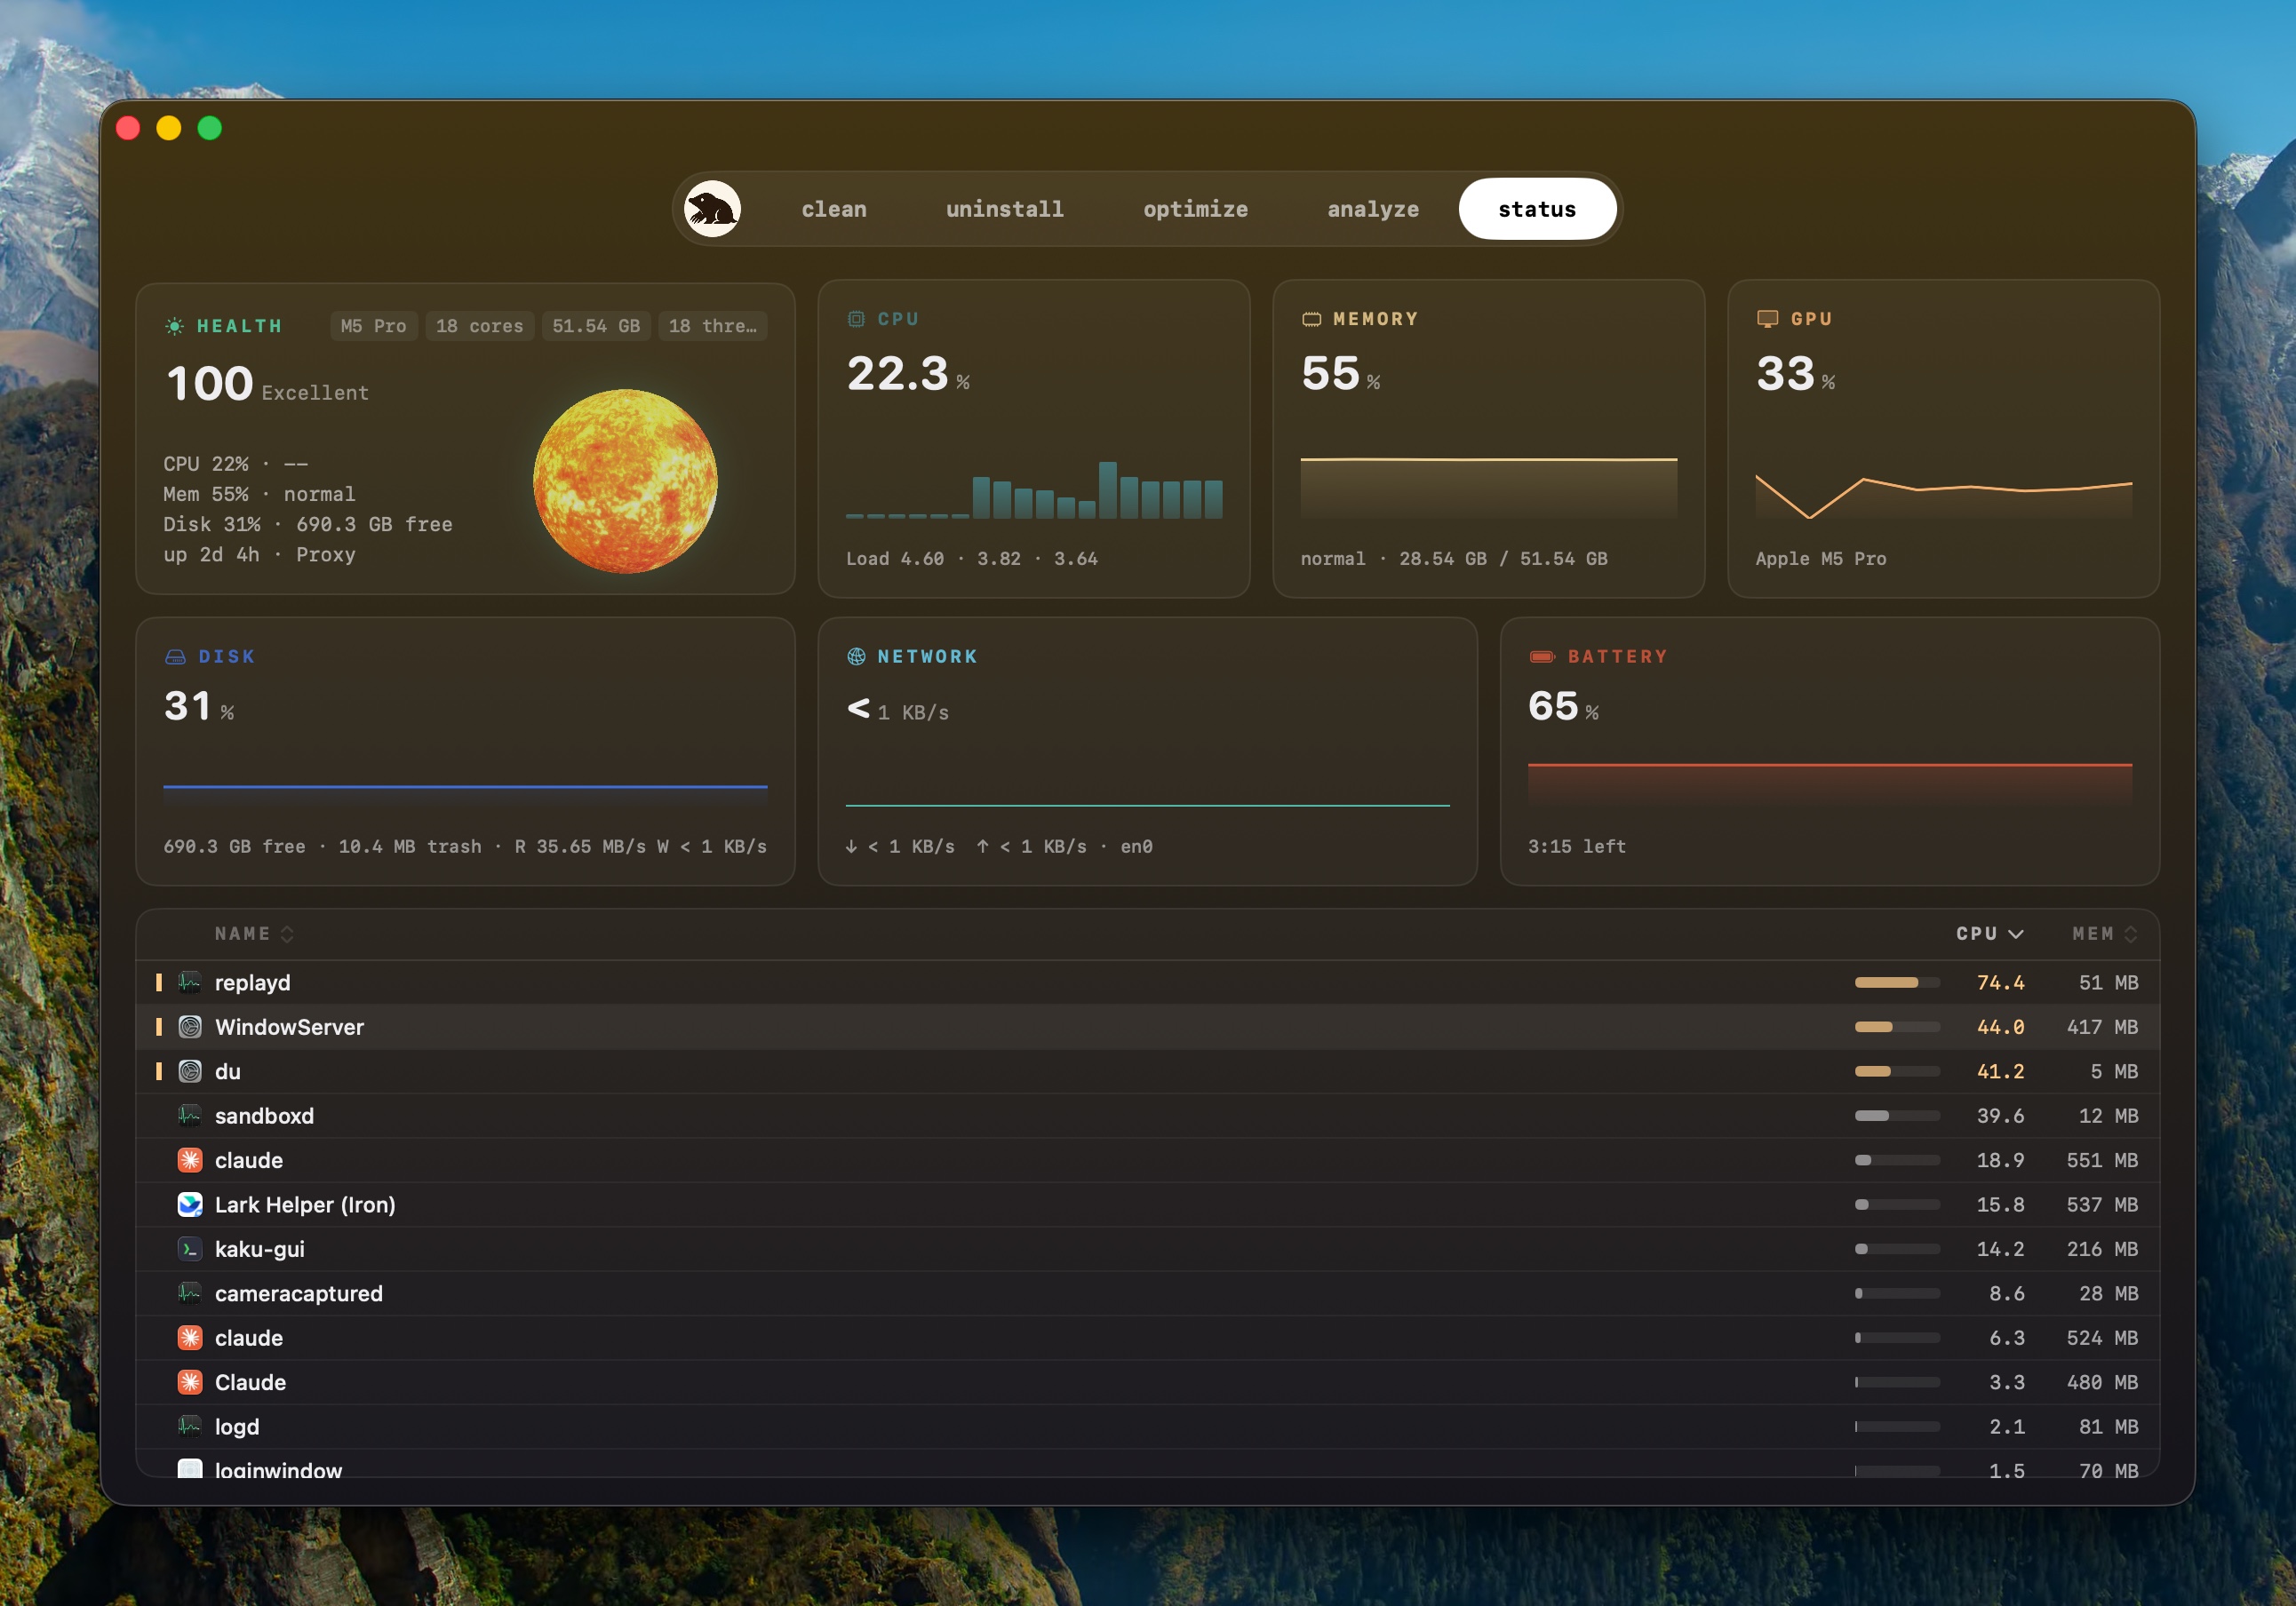
Find the process behind the number
The process list updates every second and sorts by name, PID, CPU, power, or memory. Open a row to read what the process does, pin it across refreshes, or copy its executable path. You can request a normal exit first, with force quit available if it does not respond.
Check key readings from the menu bar
The optional menu bar view can show two live metrics or the small planetary runner. Its popover adds privacy indicators for camera and microphone use, Keep Screen On, Clean Screen, and Eject when a removable volume is available. Hide the Dock icon if you only use the menu bar.
Measurements stay on the Mac
System metrics, process names, and trend samples are not uploaded. Status refreshes readings while the relevant views need them; it is not a remote telemetry service. Decorative planet motion also stops under Reduce Motion and backs off on Intel, low-power, or thermally stressed Macs.
Show controls only when the hardware supports them
Fan controls appear only on supported Macs and offer Auto, Cool, and Max modes. Battery, thermal, accessory, and fan details vary by model and by what macOS exposes. An unavailable signal stays unavailable instead of being estimated from a different metric.
Check why the Mac is hot or slow
Status is useful when a Mac feels hot, slow, noisy, power-hungry, or unexpectedly busy. Download Mole, inspect the live dashboard, or read the full Status and menu bar reference.