Mac Optimization Apps: Three Different Jobs Behind One Word
Three unrelated jobs are sold under the word "optimization", which is why so many optimizer apps change nothing. One is a storage problem. One is a question of what runs when you did not ask for it. One is a repair to a subsystem that has gone wrong. They have different symptoms, different mechanisms, and different tools, and running all three on a healthy Mac has a good chance of leaving it slower. Working out which one you have takes minutes with software already on the machine, so the taxonomy comes first.
The three jobs that share one word
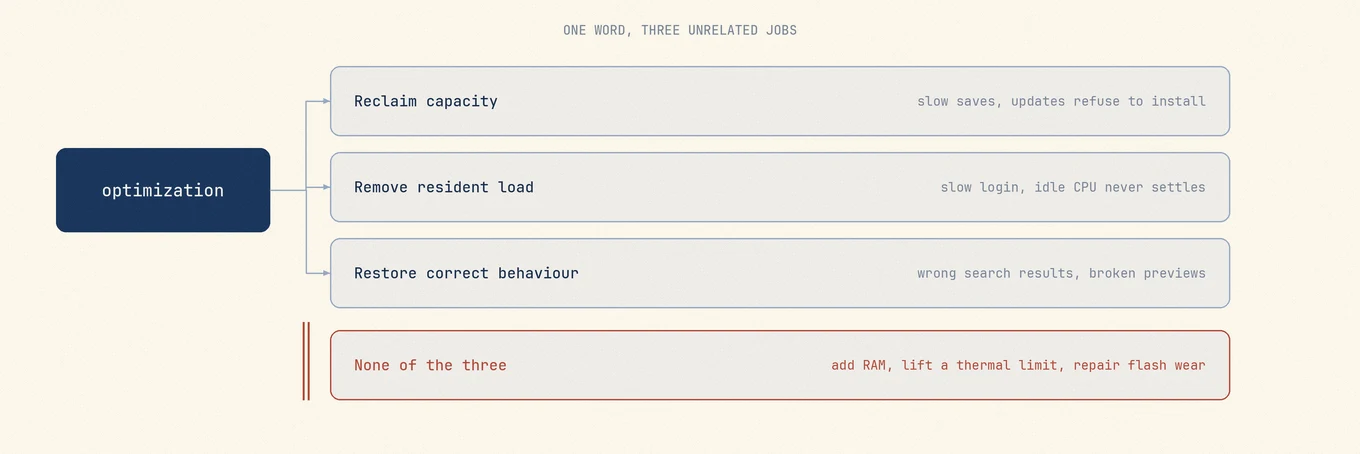
Reclaiming capacity is a storage problem dressed as a performance problem. The Mac is not slow because it is dirty, it is slow because macOS is doing extra work to satisfy every write.
Removing resident load is about processes that exist without you opening them: login items, background helpers, launchd agents, updaters, browser helpers. The win is real but bounded, showing up in login time and idle power, not peak speed.
Restoring correct behaviour covers repairs: reindexing Spotlight, flushing a DNS cache, resetting a stuck preview cache. They fix a subsystem answering wrong rather than adding speed, so running them on a working Mac is a straight loss.
Capacity: a storage problem in a performance costume
APFS is copy-on-write. Modifying a file does not overwrite its blocks in place; new blocks are allocated and the metadata is repointed, so editing a large file can need free blocks even though the file is not growing. Snapshots keep old blocks referenced while they exist. macOS also wants room for swap, temporary files, and a full staged copy of a system update, which is why an update can refuse to install on a volume holding more free space than the download.
When space gets tight an allocation stops being instant, because the system reclaims first: evicting caches, thinning eligible snapshots, purging optimized cloud content. That is real I/O before your write completes. Flash adds a second effect underneath, since it is erased in much larger units than it is written, so a controller with few free blocks must consolidate valid data before it can erase. That layer is not observable from macOS, so treat it as a reason not to live at the edge.
The rule you will read everywhere is to keep 10, or 15, or 20 percent free. None of those is an Apple specification, and Apple does not publish the trigger for its own "startup disk is almost full" alert either. The honest replacement for a percentage is an allocation: keep room for the largest thing you routinely do, which for most people is a macOS update staging itself.
df -h /
diskutil info / | grep -i "Container"
Write the figure down, make one change, read it again. The task that was failing is the test, not the ratio. The same job in Mole is Analyze, which draws the volume as a treemap so the consumer is a rectangle rather than a guess, then Clean for the cache candidates it can name. The manual route is finding large files.
Resident load: what runs when you did not open it
Four families get merged into one here: apps set to open at login, background items registered through Service Management, launchd agents and daemons with their own plists, and helpers an app spawns for itself, such as a browser's per-site renderers.
Why "I quit it and it came back" is normal
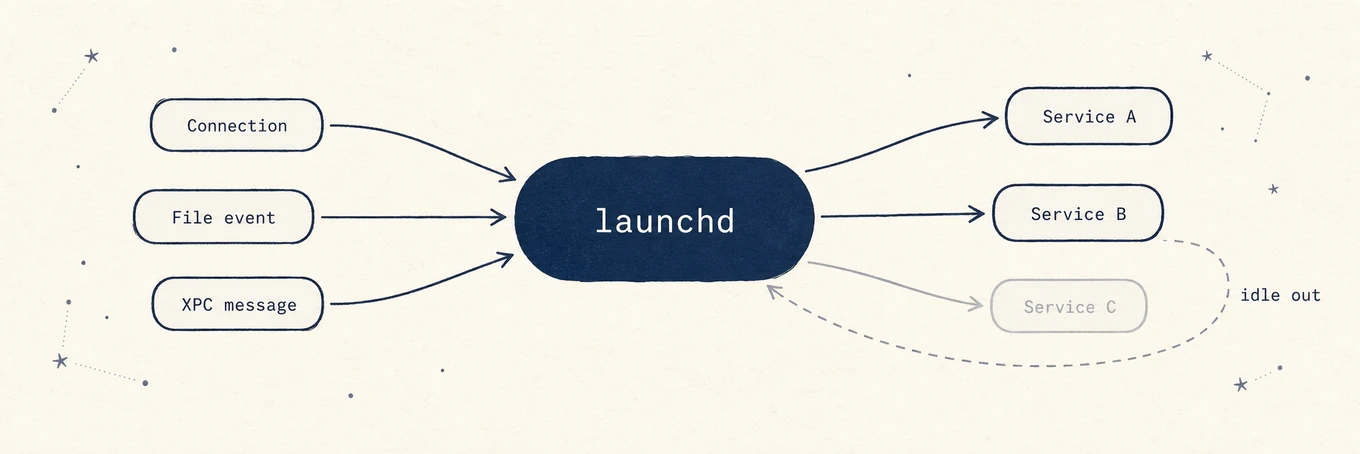
launchd does not keep every background job running. For most it registers a condition and waits: an incoming socket connection, a change to a watched path, an XPC request, a calendar interval. When the condition fires launchd starts the job, and when the job idles it is allowed to exit. The running set therefore shifts through the day, and force-quitting one of these processes only means it starts again at the next trigger.
So killing processes is not optimization. Turn the item off in System Settings > General > Login Items & Extensions or in the owning app's preference, then test the feature it provided.
What launchctl print-disabled actually shows
launchctl print-disabled gui/$(id -u)
disabled services = {
    "com.raycast.macos.RaycastLauncher" => enabled
    "com.apple.Siri.agent" => disabled
    "ddddxxx.LyricsXHelper" => enabled
}
Despite the heading, this is not a list of disabled services. It is the persistent
override database for one domain: every label for which an explicit enable or disable
decision was recorded, plus which decision it was. Most entries read enabled, and an
absent label has no override recorded, which is not the same as not being installed.
So it answers "what have I or an app explicitly turned off", not "what is running".
launchctl print gui/$(id -u) is the read-only view of the live user domain, and its
service labels do not always match filenames or app names, so never infer a plist from a
process name and delete it. The full procedure is in
disabling startup programs.
Be honest about the prize. Removing four idle helpers buys a faster login and a little less ambient power, not a faster build, and a backup agent or sync client is usually worth what it costs.
Repairs: correct behaviour, not extra speed
Each of these fixes one specific wrong answer:
- Reindexing Spotlight fixes search that misses files it should find. Check state
with
mdutil -s /first; a full rebuild costs hours of CPU, heat, and battery and gains nothing but correct results. - Flushing DNS fixes stale resolver answers after a bad DNS server or a VPN
transition:
sudo dscacheutil -flushcache; sudo killall -HUP mDNSResponder. It does not rebuild your routing table; a route flush is a far larger blast radius that can drop an active tunnel or system proxy. - Resetting a stuck preview cache fixes previews that render wrong, and the next few previews are slower while it refills.
None makes a healthy Mac faster. Run one against a named symptom; anything offering all of them on a schedule is selling ritual.
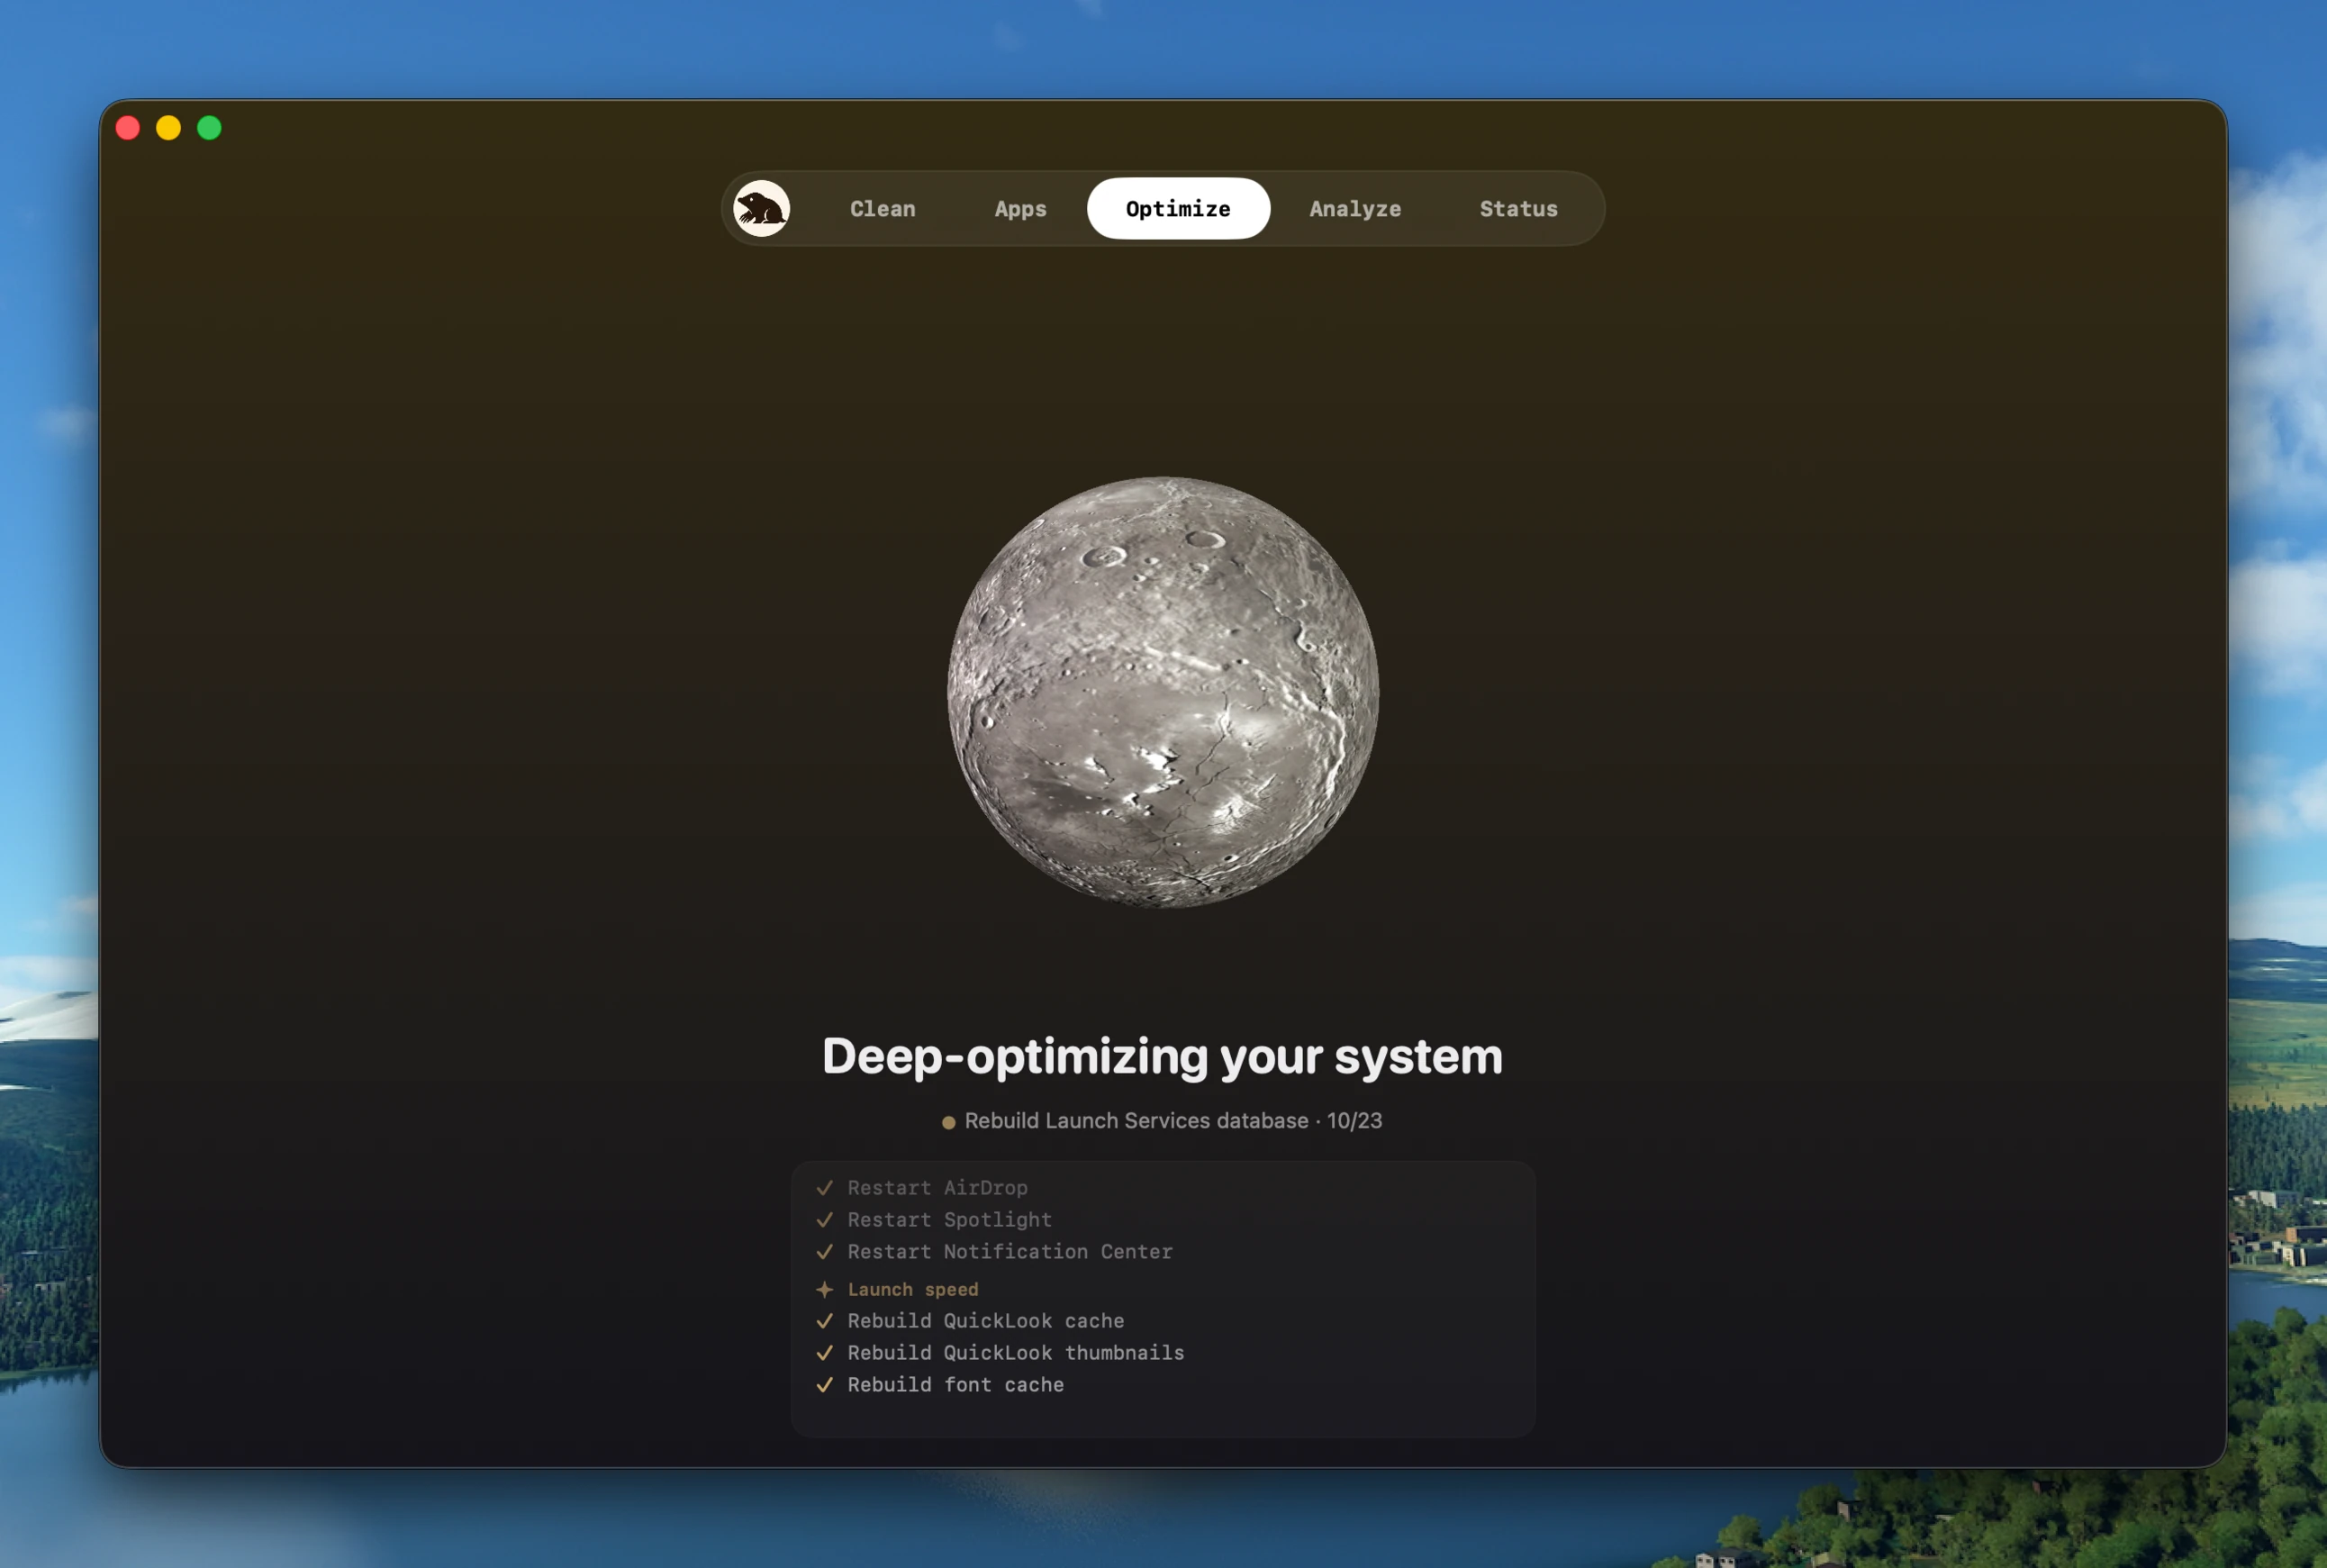
Mole's Optimize view groups these into one reviewable run and reports skipped work with a reason, including network operations it refuses to run while a VPN or system proxy is active. A skip with a reason beats a checkmark that hid a decision.
What optimization cannot be
No cleaner adds physical RAM or reverses flash wear. Thermal slowdowns need a closer look
at workload and cooling, not a generic cleanup pass. High kernel_task usage can accompany
thermal management but is not proof of it by itself. Software changes can reduce unnecessary
work; they do not replace a hardware repair or a memory upgrade.
The memory claim is the one optimizer apps still lean on, and it is backwards. macOS fills unused RAM with file cache and releases it the moment a program needs the space, so a high "Memory Used" figure alone does not establish a problem. Memory pressure is the number that predicts how the Mac feels, and swapping is not a fault: the kernel writes out pages untouched for a long time even when memory is comfortable. A memory cleaner drops caches the system paid to build, so the meter improves and the next few minutes get slower, as memory pressure explained sets out.
Diagnose first, then pick a tool
Reproduce the symptom and take readings while it is happening, because a snapshot taken
afterwards can miss the cause. df -h / for capacity, top -o cpu for what is consuming
CPU, pmset -g therm for recorded thermal state, plus the Memory Pressure graph in
Activity Monitor, which has no equally readable command-line equivalent. Then map what
you saw:
| What you observe | Which job it is | What to do |
|---|---|---|
| Little free space, saves and updates struggling | Capacity | Review large files and disposable caches; back up anything irreplaceable |
| Slow login, unfamiliar helpers, idle CPU never settles | Resident load | Audit login and background items, one owner at a time |
| Search wrong, previews broken, DNS responses stale | Repair | Run the one matching operation, then stop |
| Memory pressure yellow or red during ordinary work | None of the three | More RAM, or a lighter workload |
| CPU pinned by one named process | None of the three | Fix that workload |
kernel_task high, machine hot |
None of the three | Investigate cooling and workload before choosing a remedy |
Three of the six rows end with "no optimizer can help you", which is why this section exists. Mole's Status tab is the assembled version of those readings: about nine tiles covering health, CPU, memory, GPU, disk I/O, network, battery, thermal and fans, and uptime, each with a 60-second sparkline, above a process list refreshing every second. Sixty seconds is not stored history, and it does not pretend to be.
The tools, by which job they serve
Mole, when the answer might be any of the three
Mole covers all three meanings, and more usefully it keeps them separate instead of merging them into one button. Clean handles capacity, Software handles apps and startup items, Optimize handles repairs, Status says whether there is a problem at all.
For capacity, the order matters more than the total. Clean scans first and shows every
candidate with its exact path, owner, and size before anything moves. Anything it is not
confident about arrives unchecked, so the default action is always the smaller one.
Cache cleanup is permanent by default, with a Trash option in Settings. App uninstall uses
the Trash. Files still there can be restored; this is not a substitute for backups. Cleanup actions are recorded in
~/Library/Logs/mole/operations.log. The protection list is where the real work sits:
~/.ollama/models, ~/.lmstudio/models, and ~/.cache/huggingface are never
candidates, because those tools track shared content-addressed blobs and only they know
which blob is still referenced. Sessions under ~/.codex/sessions and
~/.claude/projects are never touched at any age.
For resident load, the Software tab puts app inventory, update state, and startup items on one screen, and only toggles what it can match to a validated launchd job or a system-registered login item. Anything it cannot prove routes you to System Settings rather than writing to a protected database or inventing a service label.
In practice: read the Status tiles first, then open the tab matching what you saw. A full disk means Clean, slow login means Software, broken search or previews means Optimize.
Mole's boundary, plainly: not malware response, not a backup, and not a substitute for a vendor uninstaller on software shipping drivers, VPN components, or system extensions.
It is a $19 one-time purchase with free updates, two Macs per license, macOS
14 or later, and a 14-day refund. Scanning is always free and each paid tool runs twice
for free, so the claims above are checkable before paying, and everything runs locally
with no telemetry. In a terminal the Mole CLI is free
and open source under GPL-3.0 via brew install mole, with --dry-run on every
destructive command.
iStat Menus, for watching load and capacity over time
iStat Menus from Bjango performs none of the three jobs. It tells you which one you have, and it is the deepest option for that: per-core CPU with history graphs, memory usage with pressure, compressed memory and swap, disk space and activity with S.M.A.R.T. status, network bandwidth broken down by app, sensors, and battery state. Version 7.3 requires macOS 11 or later. It sells as a one-time purchase in single and family editions with a time-limited trial, and through Setapp; check the official page for current terms.
The history graphs and per-app bandwidth help with job two: they let you investigate apps that quietly use the network overnight. It does not clean, uninstall, or repair anything, and that focus is a feature, as beyond iStat Menus works through.
Sensei, for hardware health context with cleanup attached
Sensei from Cindori sits between diagnosis and capacity. Its page describes CPU, GPU and battery statistics, temperature and fan monitoring, S.M.A.R.T. drive health, battery cycle counts, a disk speed benchmark, an SSD Trim control, and a status bar monitor, alongside cleanup and app uninstall features. Its store page offers an annual subscription and a one-time license, each valid for up to three Macs, and states no macOS version floor. Consider it when drive and battery health is the main attraction, a fit worked through in beyond Sensei.
TG Pro, for the thermal question specifically
TG Pro from Tunabelly Software is the widest sensor reader here: per-core CPU on Apple Silicon, GPU, storage over S.M.A.R.T., battery health, and board sensors that vary by model, alongside temperature-triggered Auto Boost rules, alerts, CSV logging, and diagnostic reports. It lists macOS 10.13 through macOS 26, is a one-time purchase, and its FAQ states one license covers up to three Macs for personal use and that 2.x updates have been free.
It helps investigate thermal slowdowns, which a generic cleanup pass does not diagnose. Check workload and cooling before deciding what to change. Fan control runs through a privileged helper, a permission to grant deliberately.
OnyX, for named repair operations
OnyX from Titanium Software is free with a donation request and serves job three directly, exposing maintenance as explicit controls rather than recommendations: verifying the system file structure, cleaning, uninstalling applications, deleting caches, rebuilding databases and indexes, and configuring Finder, Dock, Safari, and Apple applications. It ships a separate build per major macOS release, and says so plainly: "There's a specific version of OnyX for each major operating system version. Use the correct version, and don't try to use a version intended for an earlier operating system." Run only an operation you can name.
Activity Monitor, the free baseline most people should try first
Apple's Activity Monitor covers CPU, memory, energy, disk, network, and cache activity, and is the authoritative view of processes on the machine. It closes the diagnosis step for jobs one and two on its own: the Memory tab holds the pressure graph, the CPU tab names the process, the Energy tab exposes helpers that cost power while idle, the Disk tab shows I/O during a pause.
Its weakness is assembly, not capability. It is a window rather than a glance, and it will not attribute a hidden Library folder to an owner. Anyone about to buy an optimizer should spend ten minutes here first, since it settles which job you have for nothing.
Quick comparison
| Tool | Job it serves | Licensing (verify current terms) |
|---|---|---|
| Mole | All three, kept separate | One-time, two Macs |
| iStat Menus | Diagnosis, with stored history | One-time, single or family |
| Sensei | Hardware health plus cleanup | Subscription or one-time, 3 Macs |
| TG Pro | Thermal and sensor depth | One-time, 3 Macs |
| OnyX | Repairs, named explicitly | Free, donation requested |
| Activity Monitor | Diagnosis, live only | Included with macOS |
FAQ
Do Mac optimizer apps actually work?
The honest ones do a bounded job well. Freeing capacity works because storage is a real constraint, removing resident load works in login time and idle power, and repairs work when something is broken. What does not work is the promise underneath most marketing, that a sweep speeds up a Mac with nothing wrong with it.
How much free space should a Mac have?
There is no official figure, and every percentage you read is somebody's rule of thumb.
The useful version is an allocation rather than a ratio: enough for a full macOS update
to stage, plus working room for swap under your normal load. Measure with df -h /
before and after a change, and judge by whether the task that was failing now succeeds.
An app keeps restarting after I quit it. Is that malware?
Almost never. launchd starts most background jobs from a trigger and lets them exit when idle, so quitting the process leaves the registration in place. Turn the item off in Login Items & Extensions or in the owning app's settings rather than killing the process, identifying the owner first with disabling startup programs.
Is rebuilding the Spotlight index worth it for performance?
No. A rebuild fixes wrong or missing search results and nothing else, and costs hours of
background indexing that makes the Mac slower while it runs. Check mdutil -s / and
rule out exclusions and privacy settings before triggering one, and never schedule it.
Where to go next
If you still do not know which resource is saturated, why your Mac is slow walks the bottlenecks in order. If the reading that worries you is the memory graph, memory pressure explained covers why "Memory Used" is the wrong number. If the answer was resident load, disabling startup programs is the procedure that does not break sync, backup, or VPN.