Why kernel_task Uses High CPU
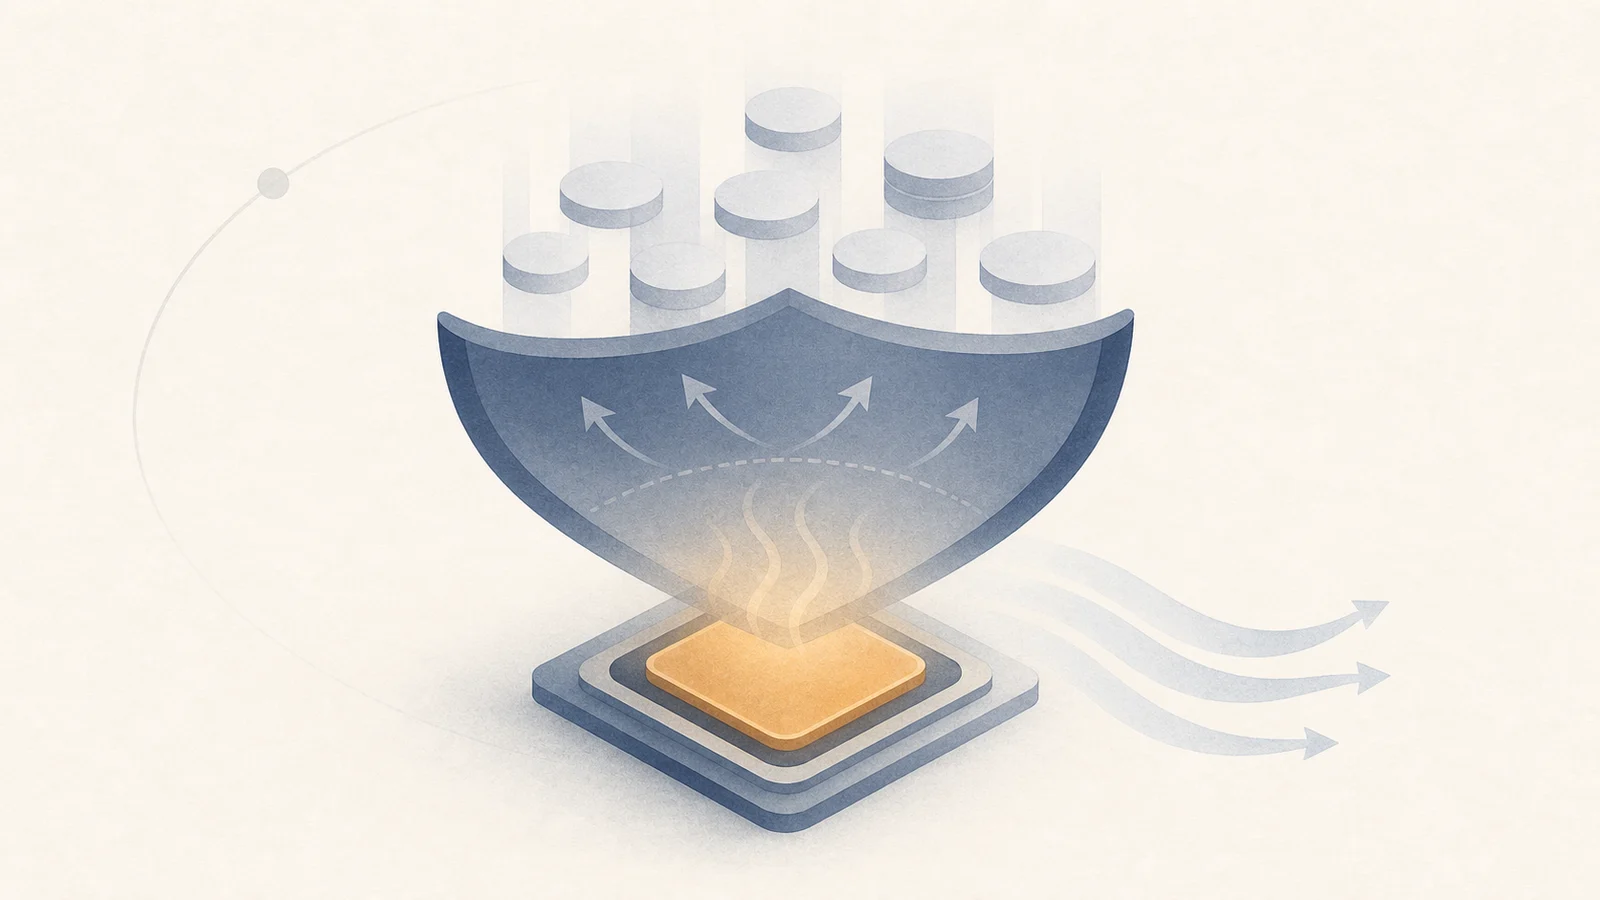
kernel_task is the macOS kernel, so it cannot be treated like an ordinary app. Apple
documents high apparent CPU as one way macOS
manages processor temperature: making CPU resources less available to other processes
reduces the heat they can generate. That makes kernel_task a response signal, not
automatically the original heat source.
What kernel_task actually is
kernel_task is the macOS kernel itself, the core of the operating system. It
manages memory, hardware, and scheduling, so it is always running. Its position in
the list depends on how you sort it. What looks alarming is when its
CPU use suddenly climbs to 50%, 100%, or more and the Mac turns sluggish.
Why it can spike in response to heat
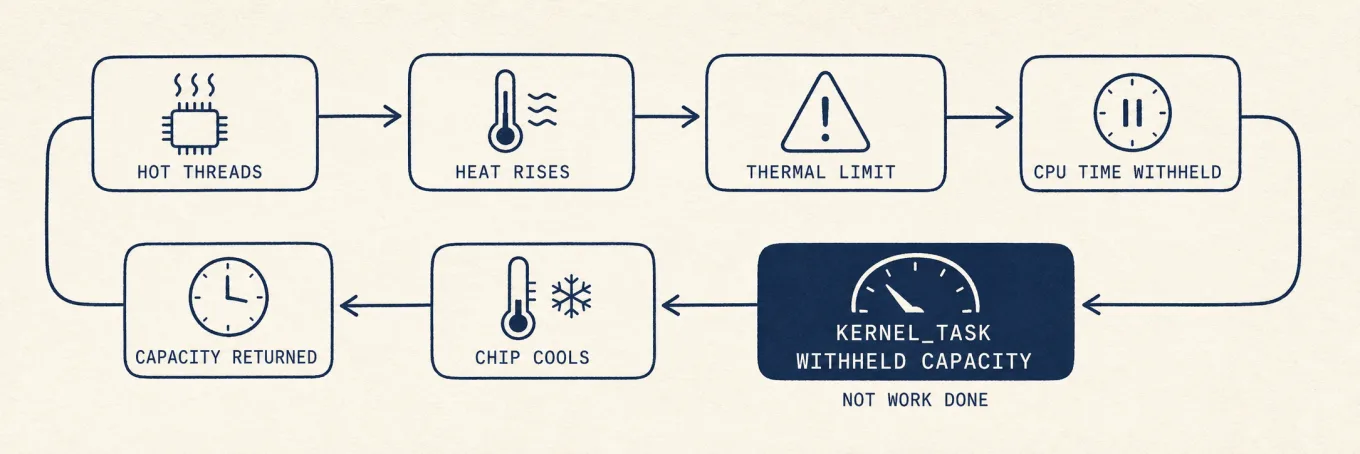
When a Mac gets hot, macOS can make CPU resources less available to heat-generating
processes. High kernel_task CPU can accompany that response, so it need not mean
the kernel caused the heat. A heavy app, poor airflow, or a warm room may be involved.
Other kernel work also contributes to the percentage; correlate it with thermal
state before deciding that heat explains the reading.
You can confirm the thermal story rather than guess:
pmset -g therm
This reports recorded thermal and performance warning state when available. For one finite sample of thermal pressure and power draw, use:
sudo powermetrics --samplers thermal,cpu_power -n 1
Neither command turns the kernel_task percentage into a temperature. Compare the
state under load and after the Mac cools.
Why you cannot, and should not, kill it
macOS will not let you force-quit kernel_task, and that is correct: it is the kernel. Trying to end it, or looking for a way to "disable" it, is aiming at the wrong target. It is doing its job. Ending the heat source is what actually lowers the number.
How to actually bring it down
Treat it as a thermal investigation. Sort Activity Monitor by CPU and identify the workload that preceded the response. Pause that workload, disconnect unnecessary displays or peripherals, use the Mac on a hard surface, and keep vents unobstructed. Compare the same readings after cooling. If the behavior occurs at idle, follows one power accessory, or returns immediately after a clean restart, test with known-good Apple-compatible power and peripherals and run Apple Diagnostics. Persistent idle thermal behavior deserves service rather than more process killing. The broader heat playbook is in why a MacBook fan runs loud.
Under the hood: what "high CPU" is really measuring
The Activity Monitor figure should not be interpreted as a meter of withheld compute.
Apple's documented behavior is that kernel_task can make CPU resources less
available to processes generating heat. Scheduling, accounting, drivers, and other
kernel work still exist, so the percentage is evidence to correlate with workload and
thermal state, not a direct conversion to degrees or throttling percentage.
Use pmset -g therm for recorded warning state and a bounded powermetrics sample for
thermal pressure. Sensor access and labels differ across Intel and Apple silicon Macs,
so trends under a controlled workload are more reliable than one universal threshold.
Where a monitor helps
Activity Monitor, powermetrics, or Mole's Status view can place process load,
thermal trend, and fan behavior on one timeline. That correlation is useful; manually
forcing fans is not a substitute for finding an idle heat source, blocked airflow, or
failing hardware.
A repeatable diagnosis
Record the workload, kernel_task trend, and thermal state; pause the source and cool
the Mac; then repeat the same workload. If the response follows load and recovers, the
protection is working. If it happens at idle or with one accessory, isolate hardware
and run diagnostics. Never attempt to disable or force-quit the kernel.