Google Chrome Helper (Renderer) High CPU on Mac
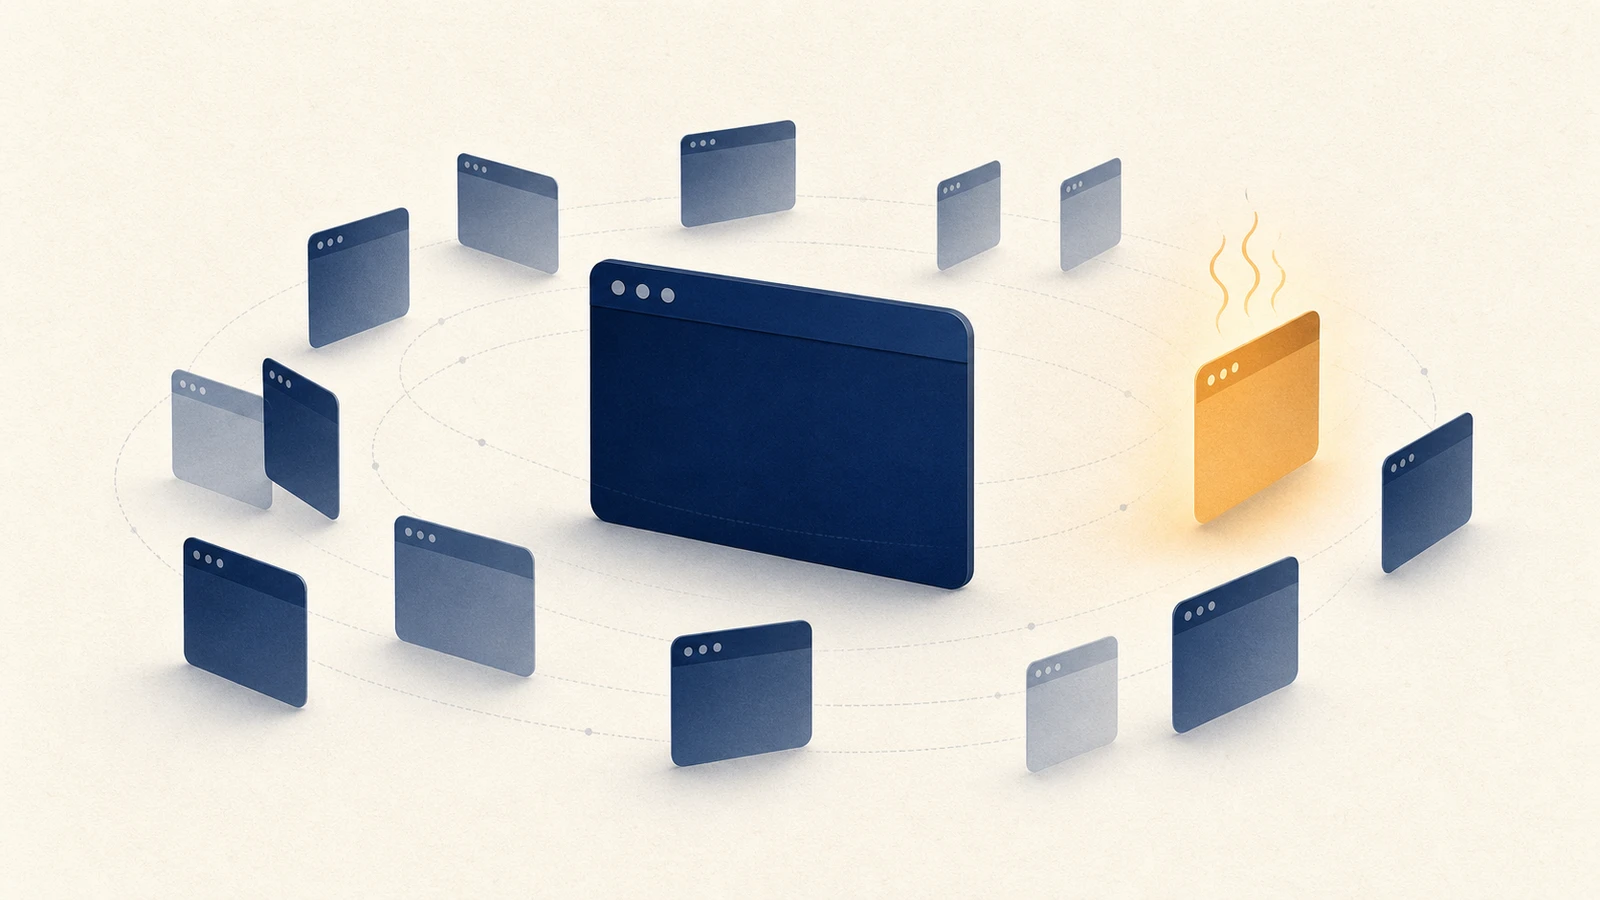
If Activity Monitor lists a stack of Google Chrome Helper and Google Chrome Helper (Renderer) processes, the first decision is not which ones to quit. Chrome is built as a multi-process browser: one browser process coordinates many children. Extra Helpers are the normal shape of that design. What needs investigation is a Helper that stays high on CPU, memory, or energy after the page has settled. That case needs mapping. Mass termination hides the owner and can drop unsaved work.
The normal multi-process shape is not proof of malware. A Helper that stays high in Activity Monitor is a clue to investigate, not a verdict.
If Chrome Helper (Renderer) is high right now
- In Chrome, open Window › Task Manager and sort by CPU or memory footprint.
- Match the busy task to a tab, extension, Renderer, GPU process, or browser service.
- Save any work, close or end only that identified task, then watch Activity Monitor for another minute.
If the load falls and stays down, you found the owner. If it immediately returns, keep the process visible and continue with the checks below instead of repeatedly force-quitting every Helper.
What each Chrome process is for
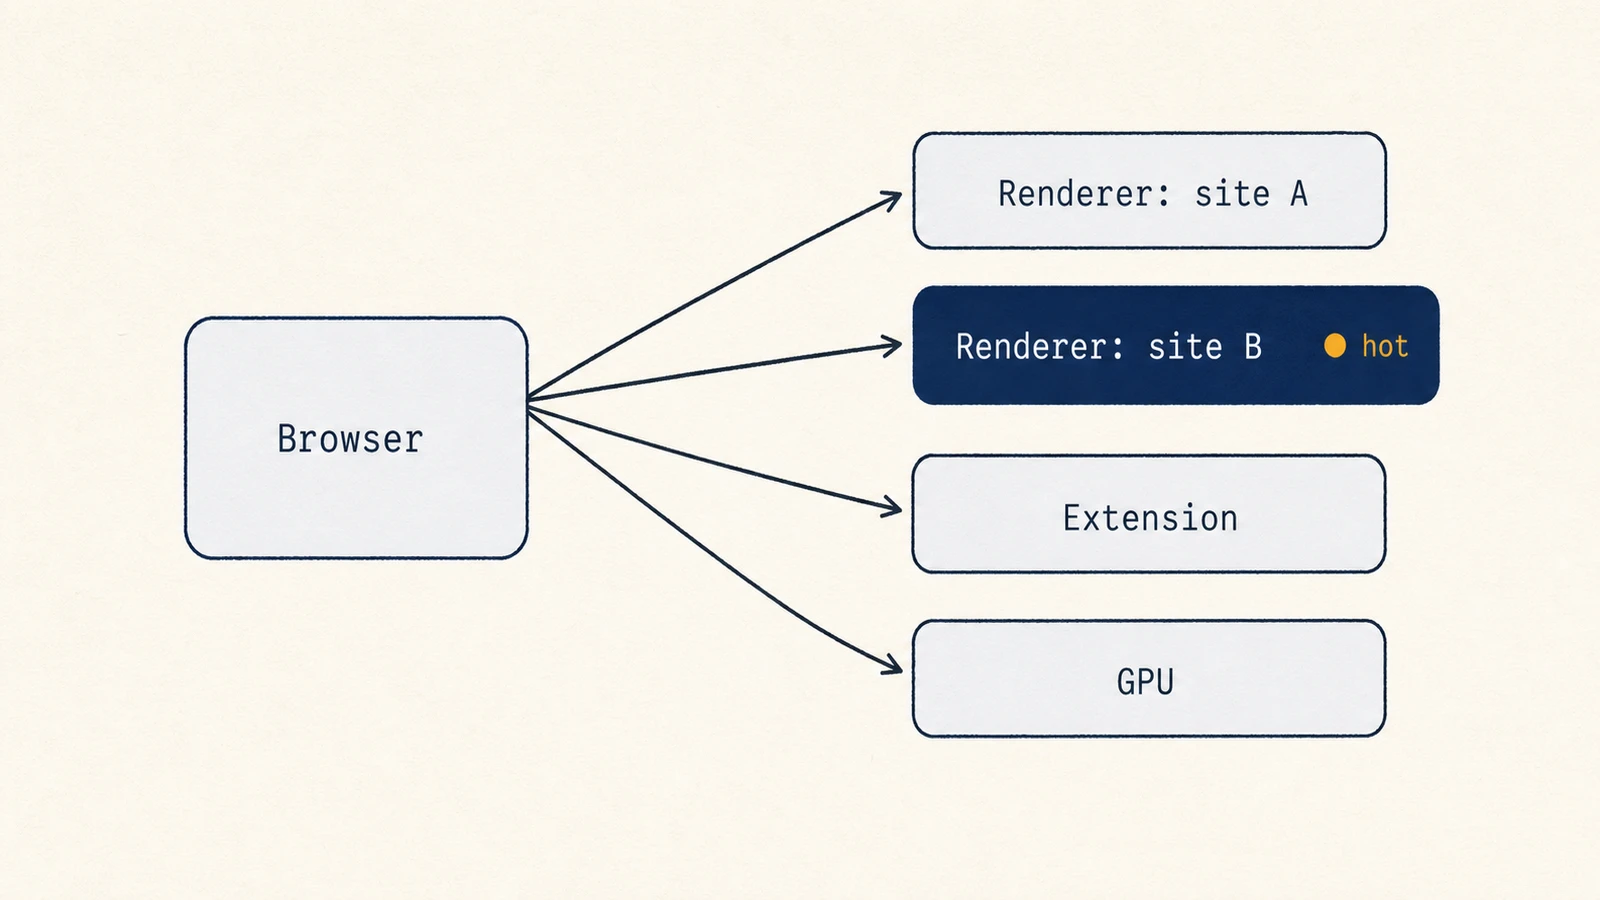
The browser process owns the chrome around the page: windows, tabs, menus, the address bar, and the lifetime of child processes. Most site JavaScript does not run there.
A renderer process handles web documents. Chromium is explicit that a renderer can contain one or more frames, and that a tab is not reliably one renderer. Site Isolation on desktop Chrome treats a site as a security boundary, so a cross-site iframe can require another renderer. That extra process is a security cost with a memory bill, not proof that something is broken.
Chrome also keeps a separate GPU process. In Chromium's GPU-accelerated compositing design, one GPU process normally serves the browser instance. Renderers send graphics commands to it. A spike on a GPU task is a compositing or hardware-acceleration question, not automatically a too-many-tabs problem. Tell a busy GPU process apart from a busy Renderer by what drives it: the GPU process climbs with compositing work such as video playback, canvas or WebGL, heavy scrolling, and animation, while a Renderer climbs with one site's scripts. When the GPU process is the high one, opening or closing tabs changes little, the controlled hardware-acceleration test below is the one that applies, and deleting a Helper binary never is.
Network and storage services, plus other sandboxed utility processes, sit beside those roles. They fetch, cache, and perform bounded jobs so a compromised page cannot reach the whole browser. They can appear as Helpers in Activity Monitor even when no tab looks busy.
Extensions do not have one fixed process name. Chrome Task Manager may show an extension as its own task. The same extension can also add work to a renderer or a background task. Activity Monitor will still label much of that work Google Chrome Helper or Google Chrome Helper (Renderer). The name is a family, not a map.
Confirm that the process belongs to Chrome
Before ending anything, prove that the Helper belongs to the Chrome installation you intend to inspect. Apple's Activity Monitor process view can show more than the display name.
Select the process, open the Info window, and inspect Open Files and Ports. A
genuine Chrome helper should resolve inside the installed Google Chrome.app bundle,
often under /Applications/Google Chrome.app. A copy launched from Downloads,
another Chromium-based app, or an unrelated path needs separate investigation. Do
not delete a binary or folder because its process title contains "Google Chrome
Helper." A name can be copied; the executable path and owning app are stronger
evidence.
This check also avoids blaming Chrome for another Chromium app. Many browsers and Electron apps ship similarly named helper executables. Ending the wrong process will not cool Chrome, and it can interrupt work in the other app.
Use Chrome's map and Activity Monitor's trend
Once the path is inside Google Chrome.app, switch to Chrome's own view.
Chrome Task Manager
is under More › More tools › Task manager. It lists tabs, subframes, extensions,
GPU work, and browser services with resource columns. Sort by the metric that matches
the problem, then select a row only after you can name the task.
End process is narrower than quitting the browser, but it is not harmless. Google warns that unsaved work in that task can be lost. A draft, partially completed form, or in-progress upload can disappear with the renderer. Save the work first, then end only the identified row.
Activity Monitor is the system-wide trend layer. It shows whether Chrome is the Mac's resource owner, whether the load is concentrated in one Helper, and whether the cost is CPU, memory, or energy. It cannot reliably map a Helper back to a document or extension. Chrome Task Manager has that internal relationship. Use both layers instead of expecting either one to answer every question.
If several renderers stay high together, look for a shared cause: one site family, one extension injected into every page, or media that is still decoding in the background. Site Isolation can multiply renderers on purpose. The useful question is which isolated task keeps doing work.
CPU, memory, and energy are different signals
Apple documents Energy Impact and 12 hr Power as energy measures, not aliases for CPU percentage. Read the column that matches the complaint.
| Measure | What it reports | Use it when |
|---|---|---|
| CPU | Processor time used now | Fans, heat, lag, or a Helper stuck near the top of Activity Monitor |
| Memory | RAM held by the process | Memory pressure, swapping, or Chrome growing after many tabs |
| Energy Impact | Relative current energy use | The Mac feels warm or drains quickly even when CPU looks moderate |
| 12 hr Power | Average energy use on Mac laptops | A Helper looks quiet now but has been expensive over several hours |
A renderer can be quiet on CPU and still large in memory because a site remains in its own process. A short CPU spike while a page first renders is also not a verdict. Wait for the page to settle and watch the same task long enough to distinguish a burst from sustained work.
Choose one primary metric before changing a setting. If the complaint is a loud fan, start with CPU and Energy Impact. If the complaint is memory pressure, use Chrome Task Manager's memory column and Activity Monitor's Memory pane. Mixing all four numbers into one vague "Chrome is heavy" judgment makes the next comparison impossible.
Apply the narrowest remedy
End one identified task
In Chrome Task Manager, end the tab, subframe, or extension you have already named. Do not clear the Helper list from Activity Monitor. If the same row returns at the same cost after a reload, the page or something acting on that page is the cause, not a disposable leftover process.
Disable extensions one at a time
Google's
extension controls
are under More › Extensions › Manage extensions, or at
chrome://extensions. Turn off one extension, reload the same pages, and observe the
same metric for the same period. An extension can appear as its own task or inflate a
renderer that still carries the site's title. If the metric does not move, turn that
extension back on before testing the next one. Disabling everything at once can make
the symptom disappear without identifying the cause.
Use Memory Saver for inactive-tab memory
Chrome's
Performance settings
are available under Settings › Performance and at
chrome://settings/performance. Memory Saver deactivates unused tabs and reloads
them when you return. It addresses inactive-tab memory, not a currently busy CPU
task.
Google also lists work that can prevent deactivation: active audio or video, calls, screen sharing, notifications, downloads, partially completed forms, pinned tabs, and connected devices. If the expensive Helper belongs to the tab you are watching, or to a tab that is still playing or uploading, Memory Saver may correctly leave it active.
Treat hardware acceleration as a controlled test
Google documents Use hardware acceleration when available as a troubleshooting toggle for graphics-related failures. It is not a blanket high CPU fix. Test it only when the GPU task, video, canvas, scrolling, or rendering is the symptom.
Record a baseline, change the setting, restart Chrome, and repeat the same workload. Disabling acceleration can move graphics work from the GPU to the CPU, which may raise CPU use or make video less smooth. If the measured problem does not improve, restore the original setting.
Do not remove Helper binaries, plug-in folders, or anything inside
Google Chrome.app to shorten the process list. Those helpers implement Chrome's
architecture. Modifying the app bundle can break Chrome and its updates without
fixing the page or extension doing the work.
Make the comparison reproducible
A screenshot of one spike is not enough. Run the same observation twice and change one variable.
Keep the same pages in the same windows and at the same media position. Pause or play video deliberately so it does not advance between runs. Keep the same power state, including the power adapter and Low Power Mode. Close unrelated heavy apps so another compile or export does not change the baseline.
Pick one metric from the table. Watch it for a fixed window, such as two minutes after the last page finishes loading. Note the Chrome Task Manager row name and its CPU or memory. Use the matching Activity Monitor process only after verifying its path.
Then change one variable: end that task, disable one extension, enable Memory Saver, or test hardware acceleration and restart. Repeat the same observation window. If the metric does not improve, revert the change before the next test. A setting that did nothing still contaminates the next baseline if you leave it changed.
When a change helps, repeat once after a full Chrome restart. Some costs disappear with a renderer and return as soon as the same site reopens. That result still teaches you something: the task, extension, or workload is responsible, not the existence of Chrome Helper itself.
Multiple Helpers will still be present when the diagnosis is finished. Success is a named task, a metric that moved for a known reason, and no work lost to a guess.