How to Check Mac Temperature on Apple Silicon
To check your Mac’s temperature, open Mole’s Status view and look at the CPU temperature and fan readings available for your model. Sensor support varies by Mac; fanless MacBook Air models have no fan speed to show. Activity Monitor helps identify heavy workloads, but does not show temperature.
macOS does not provide a built-in dashboard of CPU temperature and fan RPM. It does provide the more actionable thermal state: whether the system is under pressure and limiting work. Third-party tools can expose sensor readings, but the label, location, and normal range of a sensor vary by Mac. Apple also cautions that these readings are not the external case temperature and should not be used alone to diagnose hardware. A single degree value without workload and trend is easy to misread.
Seeing powermetrics: unrecognized sampler: smc? On an Apple silicon Mac, that message means the SMC sampler is not available through this command. It is not evidence of a broken sensor. Use macOS thermal state to judge throttling, or a sensor app that supports your exact Mac if you need named readings.
Ways to check, and what each can tell you
| Route | Gives you | Does not give you | Cost |
|---|---|---|---|
| Activity Monitor | Which process is driving load, energy impact | Any temperature, any fan RPM | None, ships with macOS |
pmset -g therm |
Whether macOS has recorded thermal or performance pressure | Degrees, sensor names | None, no admin needed |
sudo powermetrics |
Power and thermal-pressure detail for one bounded sample | A stable CPU or GPU temperature on Apple silicon | Admin password |
| A sensor monitor | Named sensor readings and fan RPM where the model exposes them | A threshold that transfers to another Mac | A third-party app, model-specific |
| Apple Diagnostics | A hardware verdict from Apple's own test | Live monitoring | A restart |
The order matters more than the tools. Load explains most heat, pressure tells you whether macOS is already reacting, and a degree reading is only interpretable once you know both.
What Activity Monitor shows, and what it does not
Activity Monitor, in Applications › Utilities, shows per-app CPU percentage, memory pressure, and energy impact. It is the right first stop for "what is making my Mac hot": open the CPU tab and sort by %CPU, and the process driving the load is named at the top. What it never shows is a temperature or a fan RPM. It tells you the cause of heat, not the heat itself. If the busy process is unfamiliar, what your Mac's background processes do is a good companion.
Start with workload and thermal state
Start with the thermal and performance warnings macOS makes available. This command does not need administrator rights:
pmset -g therm
If no warning information has been recorded, you may see:
Note: No thermal warning level has been recorded
Note: No performance warning level has been recorded
Note: No CPU power status has been recorded
No recorded warning is not proof that every form of thermal limiting is absent. When macOS does record pressure, it is reporting its own control decision, which is more useful than comparing one sensor against a generic internet threshold.
For one finite sample with more power and thermal context:
sudo powermetrics --samplers thermal,cpu_power -n 1
Run it only when you need the diagnostic. Compare idle and a repeatable workload
rather than leaving a privileged sampler running indefinitely. powermetrics labels
its power figures as estimates, so do not compare their absolute values across
different Macs.
Why the Terminal route stops there on Apple Silicon
On some older Intel macOS releases, sudo powermetrics --samplers smc exposed sensor
readings. On current Apple silicon systems that sampler is unavailable, and the refusal
is immediate rather than empty output:
powermetrics --samplers smc
# powermetrics: unrecognized sampler: smc
powermetrics can still report thermal pressure, but it does not present one stable
CPU or GPU temperature in degrees. There is no public, unprivileged interface that
provides a universal sensor mapping across Apple silicon Macs, which is why third-party
tools require model-specific handling.
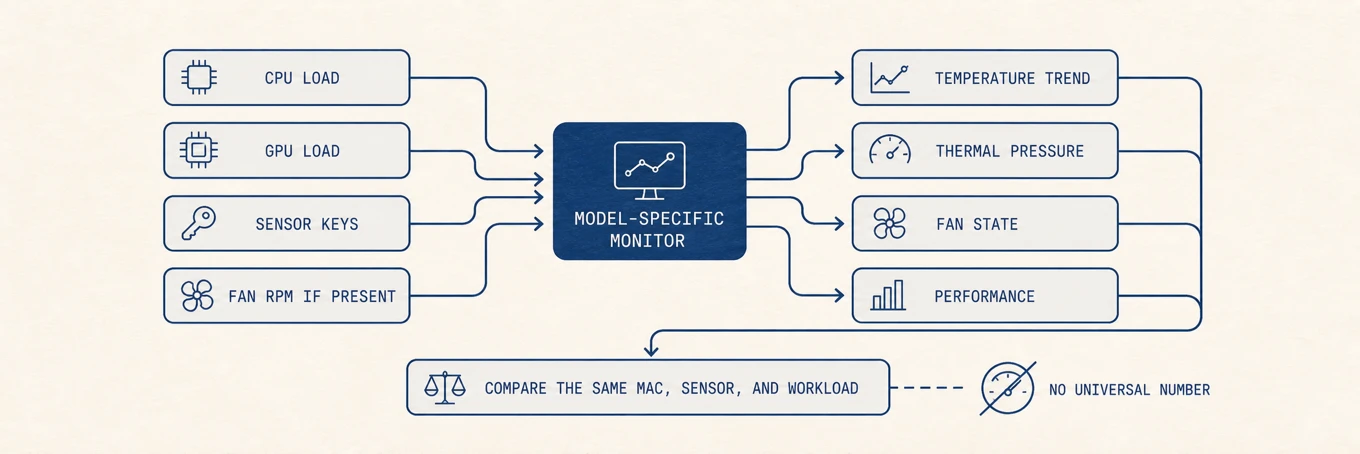
If you arrived here from an older Intel recipe, do not try to force the sampler back. The safe path is the ordered one above and takes three steps: read the recorded thermal and performance pressure with pmset, take one bounded thermal and power sample under a repeatable workload, then reach for a sensor app that supports your exact model when you need named degrees. Treat folklore that greps this command's output for a hidden die-temperature line as unreliable, because the SMC sampler those tricks depended on is the very thing current systems refuse. Do not disable SIP, and do not run scripts that force fan or SMC writes: neither makes macOS print a temperature it does not expose, and the first gives up a real protection. Mole's Status view reads model-specific sensor keys, chosen per Apple silicon generation, through the same non-public SMC and IOHID interfaces other monitors use, and it shows no temperature rather than a guess when your Mac exposes none of those keys.
Under the hood: where the numbers live
Mac thermal management combines sensors near compute blocks, storage, battery, and other components with power and fan control. Intel and Apple silicon designs expose different sensor keys, and some MacBook Air models are fanless. Third-party monitors use model-specific or non-public interfaces, so two tools may choose different sensors for a label such as "CPU temperature." RPM is meaningful only on a model that has a fan and exposes its tachometer.
Reading fan speed, and what a fan cannot tell you
Fan RPM is the most misread number on this list, because its meaning is inverted from what people expect. A fan spinning up is the cooling system working, not the machine failing; a silent fan under sustained load is the reading worth investigating. Three cases account for almost everything:
- No fan at all. Every MacBook Air since the M1 is fanless and sheds heat through the chassis, so there is no RPM to read and a warm case under load is the design.
- Fan ramps under load, settles after. The expected shape. The useful question is how long the cooldown takes with the workload gone, not the peak number.
- Fan at maximum with the machine idle. This is the one to act on. Check for a runaway process first, then a blocked intake, then a sensor fault, in that order.
The firmware owns the fan curve, and keeping that default is the right call. Manual control can trade noise for headroom during one known sustained workload, but it cannot repair blocked airflow, a failed sensor, or an idle heat source.
How to interpret a sensor reading
There is no universal "safe CPU temperature" that applies to every Mac and every sensor. Instead, record four things together: the sensor label, workload, thermal pressure, and whether performance or fan behavior changed. A brief high reading during a compile can be ordinary; a rising idle trend with no owner is more useful evidence.
Keep one local baseline if temperature matters to your work. Record the same named sensor, ambient conditions, power mode, fan state, thermal pressure, and task at idle and under one repeatable workload. Compare later readings only with that baseline. A value from another Mac model, another sensor label, or a room with a different temperature is not a limit for this machine.
The one number Apple does publish is the room, not the chip: its operating-temperature guidance puts normal ambient between 10 and 35 degrees Celsius, and recommends checking CPU activity when a Mac is warm at light load and using it on a stable ventilated surface.
When it runs hot, in order
- Name the owner. Activity Monitor, CPU tab, sorted by %CPU. Most heat has one process behind it, and quitting the right one ends the question.
- Check pressure, not just degrees.
pmset -g thermshows available thermal and performance warning information. No recorded warning does not rule out throttling; compare performance and a bounded pressure sample under the same workload. - Remove the physical causes. A soft surface, a blocked vent, direct sun, a room above 35 degrees, and a charging session all raise the floor before any software explanation applies.
- Compare against your own baseline. Same sensor, same workload, same room. A number from a different Mac model is not evidence about this one.
- Ask the hardware. Repeated shutdowns, thermal warnings at light load, a fan that grinds or never responds, or a machine that stays hot with nothing running are service symptoms. Run Apple Diagnostics before assuming that cache cleanup or a custom fan curve can fix them.
A repeatable temperature check
Record idle load and thermal state, run a fixed workload, take a bounded pressure sample, and compare the cooldown. If you use a sensor monitor, compare the same named sensor on the same Mac rather than importing a threshold from another model. Trends, throttling, noise, and workload attribution tell you more than one temperature number.
FAQ
What temperature is too high for a Mac?
There is no published per-sensor limit, and any single figure you find online belongs
to some other Mac model and sensor label. The answer macOS will give you is thermal
pressure. A missing warning in pmset -g therm is not proof that no throttling is
occurring. Apple's published operating range is for the room, 10 to 35 degrees Celsius.
Why does my MacBook Air have no fan speed to read?
Every MacBook Air since the M1 is fanless by design and cools through the chassis. There is no tachometer to report, so a monitor showing no RPM on those models is correct rather than broken.
Do I need an admin password to check temperature?
Not for the two most useful checks. Activity Monitor and pmset -g therm need
nothing. Only powermetrics requires sudo, which is why it is worth running as one
bounded sample instead of leaving it open.
Why do two monitoring apps show different CPU temperatures?
They may use different sensors, sampling intervals or calculations under the same "CPU" label. First compare one tool with itself over time on the same Mac. Before comparing two tools, check what each reading represents rather than treating the labels as identical.
Is a loud fan a sign of damage?
On its own, no. A fan ramping under load is the cooling system doing its job. What deserves attention is a fan at maximum while the machine is idle, a fan that grinds, or a fan that never spins up on a model that has one.