How to Investigate Unfamiliar Mac Processes

Activity Monitor shows apps, helpers, agents, daemons, and system services. A familiar or cryptic name is weak evidence: software can share generic names, and malware can copy one. Judge a process by its owner, executable path, parent, code signature, resource trend, and the action that triggered it.
Choose View › All Processes so the list is not limited to your account. Add useful columns such as User, CPU Time, Threads, and Kind. Double-click a process to inspect its parent, open files and ports, and recent statistics. Apple's Activity Monitor guide also offers hierarchical and system-process views. Sample Process captures what its threads are doing for a short period when it appears stuck without immediately terminating it.
The ones people worry about most
- kernel_task represents kernel work, and high CPU can include macOS limiting other processes to manage heat, covered in kernel_task high CPU.
- WindowServer draws your screen; its load rises with displays and windows, in WindowServer high CPU.
- mds, mds_stores, mdworker are Spotlight indexing your files, in mds and mdworker high CPU.
- Google Chrome Helper processes are Chrome's tabs and extensions, in Chrome Helper high CPU.
The background daemons you did not start
These run on their own and are almost always fine:
- launchd is the first process macOS starts and the parent of every service. It is always running; that is its job.
- trustd checks certificates and app signatures when apps launch or make secure connections. Brief spikes when you open an app are normal.
- nsurlsessiond handles background network transfers: iCloud, app downloads, updates. It flares while something is syncing or downloading, then settles.
- cloudd and bird run iCloud sync. They work hard right after you sign in or add a lot of files to iCloud, then quiet down.
- coreaudiod is the system audio engine. It should be light; sustained high CPU sometimes points at a misbehaving audio app or plug-in.
- photoanalysisd analyzes photo content for features such as people and objects. Scheduling is opportunistic and can vary with power, thermal state, and library work.
- backupd is Time Machine running a backup. Expect it to be busy while a backup is in progress.
- syspolicyd helps enforce system security policies, including app assessment. A spike during app installation or first launch has context; sustained unrelated work still deserves measurement.
Normal versus stuck is a pattern, not a timer
Look for correlation and progress. A process that rises after opening an app, attaching a drive, or starting sync, then moves through work and settles, is behaving plausibly. Sustained CPU with no progress, rapidly growing memory, repeated crashes, or a spike that begins after the same trigger deserves investigation. Compare a sample, open-file activity, and logs before force-quitting. Many system services relaunch because the requesting app or launch policy still needs them.
For third-party software, verify that the executable path sits inside the expected app or vendor support location and that its signature belongs to that vendor. For Apple services, changing or deleting launch configuration is rarely the fix; identify the client, file set, device, or network operation feeding the service.
Prove the owner before you quit it
Activity Monitor's inspector is the easiest route. From Terminal, the same check starts with the PID rather than the display name:
PID=1234
ps -p "$PID" -o pid=,ppid=,user=,etime=,comm=
lsof -p "$PID" | head
The parent and executable path connect a generic helper to the app that launched it; open files show the project, library, device, or database currently feeding the work. If the path belongs to a third-party app, inspect its signature without changing it:
codesign -dv --verbose=4 "/path/to/the/binary" 2>&1
A familiar name with an unexpected path or signer deserves investigation. An unfamiliar name inside a signed Apple system location is not suspicious merely because it is new to you. Quit the owning app first, then check whether the helper settles or exits before force-quitting the child process.
Under the hood: launchd and on-demand services
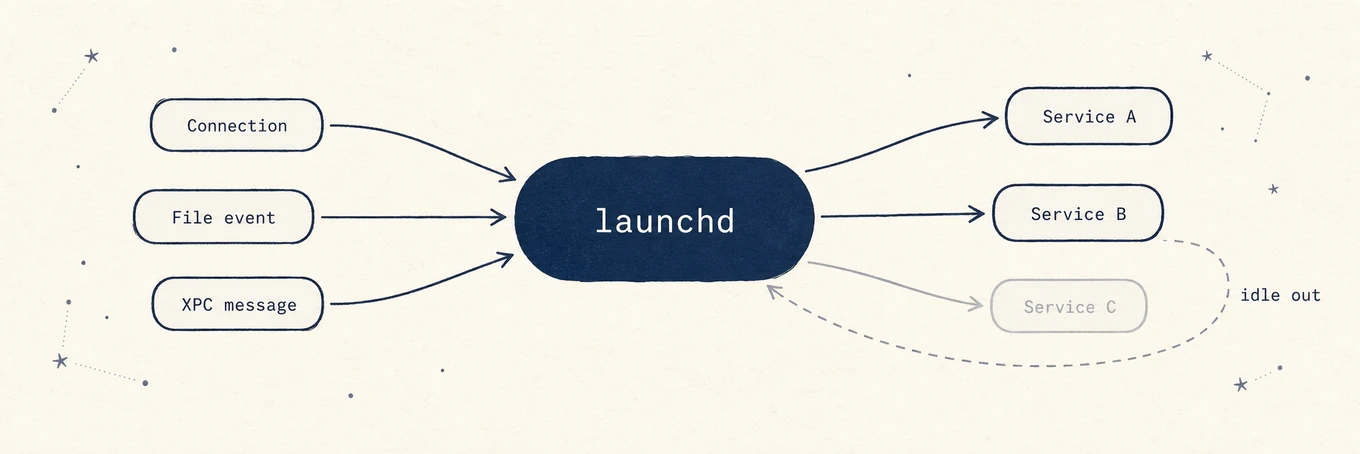
The reason there are so many daemons is launchd, the first process macOS starts (PID 1) and the parent of everything else. Most of those background processes are not running constantly: launchd registers them and starts them on demand when a matching event occurs, a secure connection that needs trustd, a file handed to an importer, an XPC message from an app, then lets them idle back out. That is why the list shifts as you work, and why force-quitting one often does nothing: launchd relaunches it the next time its trigger fires. This reframes the whole list. You are not looking at programs someone chose to run, but at a pool of small services the system starts and stops as work arrives, which is exactly why behavior over time, not mere presence, is the signal that something is wrong.
Where an explanation layer helps
Activity Monitor supplies the authoritative process and inspector data. Mole's Status view can add plain-language context and trends, but an explanation based on a name is only a starting hypothesis. Path, owner, signature, and behavior decide whether the current process is the expected one.
A repeatable process check
Record the process name, user, path, parent, signature, CPU and memory trend, open files, and trigger. Sample it while the problem occurs, then stop the requesting app or input before touching the daemon. This method distinguishes ordinary background work, a stuck vendor helper, and an impersonated name far better than a list of process definitions alone.