What Is macOS Swap Memory, and When Is It a Problem?
Swap is space on the startup disk that macOS uses for memory pages that do not need to remain in physical memory. Seeing Swap Used above zero is normal. The pattern worth investigating is swap that keeps growing while Memory Pressure stays yellow or red and the Mac becomes less responsive.
Activity Monitor records the current workload against the history of the current uptime. A 4 GB reading after ten quiet days and the same reading reached during a twenty-minute build do not mean the same thing. Read Swap Used with pressure, responsiveness, and the processes at the top of the Memory list.
What happens before macOS uses swap
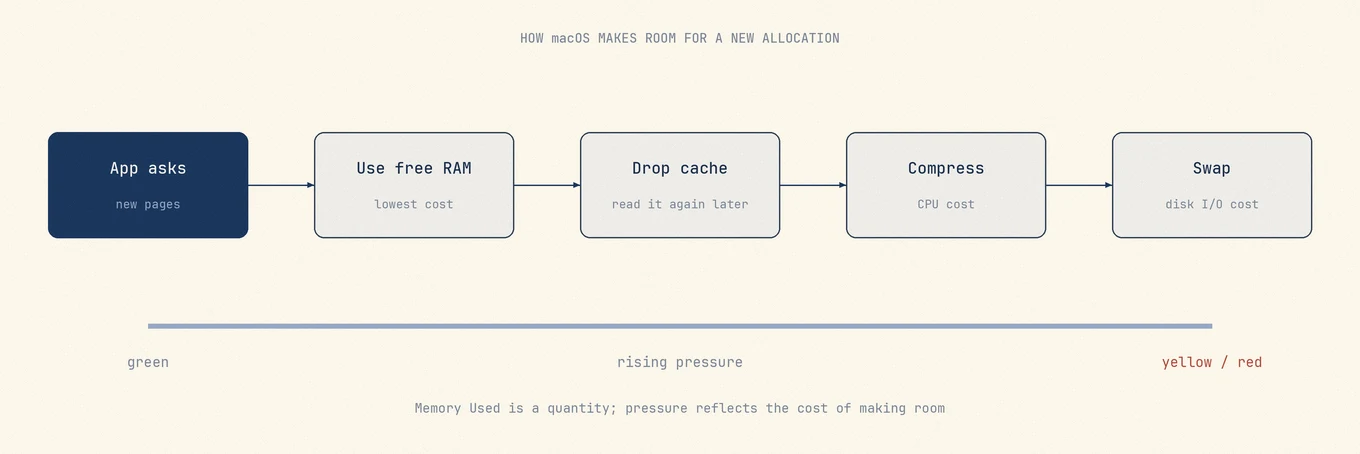
Apps allocate physical memory. When demand rises, macOS can reclaim file caches and compress less-active pages while keeping them in RAM. It can then move pages that are not needed immediately to encrypted swap files on the startup disk, bringing them back if an app touches them again.
Apple's Activity Monitor memory guide shows these as separate readings: Cached Files, Compressed, Swap Used, and the combined Memory Pressure graph. The graph matters because it includes several parts of the system's ability to satisfy new allocations, including swap rate, rather than only the total amount already swapped.
Apple Silicon uses one unified memory pool for the CPU, GPU, and other parts of the chip. A local model or graphics-heavy job can therefore compete with ordinary apps in the same pool. Unified memory reduces copying between separate pools, but it does not make an SSD page-in as cheap as reading resident RAM.
The four readings that give Swap Used context
| Reading | A quiet value can mean | A value worth investigating can mean |
|---|---|---|
| Memory Pressure | Green shows the current workload is being served efficiently | Yellow or red shows shrinking headroom or delayed allocations |
| Swap Used | Inactive pages accumulated over a long uptime | The active workload has exceeded comfortable memory capacity |
| Compressed | macOS saved RAM without going to disk | Compression activity is rising quickly under the same task |
| App Memory | Required apps have a stable working set | One app, VM, model, tab group, or plug-in continues to grow |
Swap Used is a stock: it tells you how much swap is allocated now. The costly part is movement, especially when the system repeatedly pages data out and back in. Activity Monitor does not turn that history into one universal threshold, so the colour, trend, and visible stalls have to be read together.
The same swap number can describe different Macs
| Situation | What the number probably means | What to do |
|---|---|---|
| Green pressure, responsive Mac, swap stable for hours | Older inactive pages remain on disk | Nothing yet |
| Brief yellow pressure during an export, then green | Temporary working set exceeded headroom | Compare another run only if the delay matters |
| Yellow or red pressure, swap grows every few minutes | Current active set does not fit comfortably | Find the owner and reduce concurrent demand |
| Beachballs with green pressure and stable swap | Memory is unlikely to be the current constraint | Check CPU, thermals, disk, and network |
| One process grows after each repeated action | App-specific retention or leak is possible | Save work, restart it, update it, and reproduce |
There is no reliable “too much swap” number that applies to every Mac. Memory capacity, workload, uptime, storage performance, and which pages remain active all change the cost. A screenshot from a different machine cannot supply that context.
Measure a real workload instead of an idle snapshot
Open Activity Monitor › Memory, then record Memory Pressure, Swap Used, and the largest processes before starting the task that causes concern. Run the same project, tab group, virtual machine, or model for five to ten minutes and check the values again.
Terminal can show the current allocation without changing the system:
sysctl vm.swapusage
The output reports total, used, and free swap. It is still a snapshot, so save two readings with their times and the workload between them. The built-in memory_pressure command can supply another view of the current memory state:
memory_pressure
Do not sample immediately after login and compare it with the end of a long workday. Launch agents, Spotlight, browser restoration, and the apps you opened make those conditions different. The useful comparison holds the task and environment as steady as practical.
If the Mac has just slowed down, look at the top few processes before restarting. A restart clears the evidence along with the current swap state.
Find the workload that keeps pages moving
Browsers distribute tabs, frames, extensions, and GPU work across helper processes. Use the browser's task manager or add related helpers before deciding whether the browser is the owner. A single tab with a long-running web app can matter more than dozens of suspended tabs.
Virtual machines and containers often reserve a configured amount of memory. Local AI models have a working set tied to model size, context, and other running work. Creative apps can hold decoded media, undo history, plug-in state, and large documents. These allocations are not automatically leaks, but they can leave too little headroom for the rest of the system.
An app that grows after every repeated action and does not settle after closing the document deserves a controlled restart and update check. If the same steps reproduce the growth, capture them for the developer instead of running a general memory cleaner.
Does swap wear out the SSD?
Swap contributes to total SSD writes, but Swap Used does not measure total bytes written, write amplification, or remaining drive life. Workload, memory capacity, uptime, the storage device, and how often pages move all affect the result. macOS does not expose a useful remaining-life verdict from this one counter.
Do not disable swap to reduce writes. Swap is a memory safety valve. Removing it can turn pressure into failed allocations or terminated apps while leaving the workload unchanged. If writes are a concern, reducing sustained memory pressure addresses both paging and responsiveness without altering virtual-memory internals.
Reduce sustained swap pressure
Quit work you no longer need, beginning with the largest attributable process rather than every background service. Reduce a virtual machine's allocation only if its guest still has enough memory. Close the local model when the task ends, review browser tabs and extensions, and update an app whose working set grows across each session.
A restart is useful as a diagnostic reset. Repeat the same normal workload afterward. If pressure and swap growth return, the machine needs a smaller concurrent workload or more physical memory for that use case. Apple Silicon memory cannot be upgraded later, so this observation is more useful when choosing a future Mac than a generic 8 GB, 16 GB, or 32 GB rule.
Memory cleaners and scheduled purge commands do not remove the owner. They can drop useful file caches, producing more storage reads while the allocating app remains open.
Where Mole fits
Mole shows Memory Pressure in Status and the menu bar alongside CPU, thermal state, and top processes. These monitoring views do not clear RAM or declare that a particular Swap Used number is bad. The combined view helps separate paging from a busy CPU, thermal slowdown, or another bottleneck.
For every Activity Monitor counter and a deeper command-line walk-through, read Mac Memory Pressure explained. If the question is whether to install a cleaner, see whether a Mac needs a memory cleaner.
FAQ
Should I use a memory cleaner app?
No. macOS already reclaims cached pages when needed. A cleaner changes the free-memory number without fixing an app or workload that keeps pressure high.
Does Mole show Memory Pressure?
Yes. Mole shows pressure with the other system metrics that help explain a slowdown. Use the trend and top processes rather than one isolated swap value.
How much memory is enough for a Mac?
Enough memory keeps your ordinary workload mostly green without steady swap growth or repeated stalls. The answer depends on the apps you need at the same time, not a universal capacity rule.
Should I restart when Swap Used is high?
Restart if you need a clean diagnostic baseline or one app has become unresponsive, but inspect the top processes first. A restart clears swap history; it does not fix a workload that exceeds the available memory every day.