# iStat Menus Alternatives: Pick the Monitor That Fits
> Compare Activity Monitor, Stats, iStat Menus, Sensei, and Mole by sampling cost, sensor coverage, history, and the question each one answers best.
Published: 2026-07-22 | Updated: 2026-07-25
A menu bar monitor does one thing: it reads counters the kernel already keeps and puts
them where you can see them without stopping work. That is useful, and it is also the
entire boundary. No monitor has ever fixed a runaway process, a full disk, or a
throttling chip. It tells you which of those is happening so the next step is a decision
instead of a guess. Choose one by the question you keep asking, not by how many numbers
it can fit above the desktop.
## Readout or record
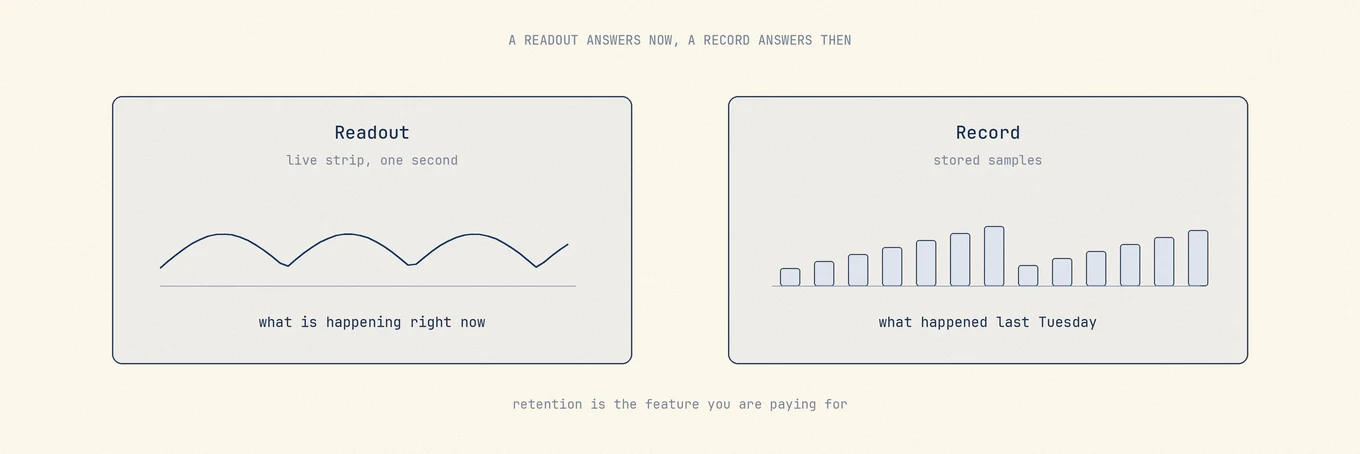
Two different products share the label "system monitor", and confusing them is why
people overbuy. A **readout** is a live strip of numbers updating roughly once a second,
answering "what is happening right now". A **record** stores samples so you can answer a
question about a moment that has already passed: why the machine was hot at three in the
morning, whether last week's battery drain was one app or all of them.
Most people need the readout. Retention is what you are actually paying for when a
monitor costs money, and if you have never wanted to look backwards, it is a feature you
will never open.
Both are sold as system monitors. Retention is the one you are actually paying for, and it is the one most people never open.
## Under the hood: what monitoring costs and why coverage differs
Many monitors start from the same classes of system source. CPU tick counts and memory
page statistics are available through Mach interfaces; disk, battery, and hardware
sensor data comes through several macOS frameworks and lower-level services; throughput
starts with per-interface byte counters. The raw sources overlap, but sampling windows,
cache policy, sensor-name tables, and derived calculations do not. Small disagreements
can therefore be implementation choices rather than proof that one tool is wrong.
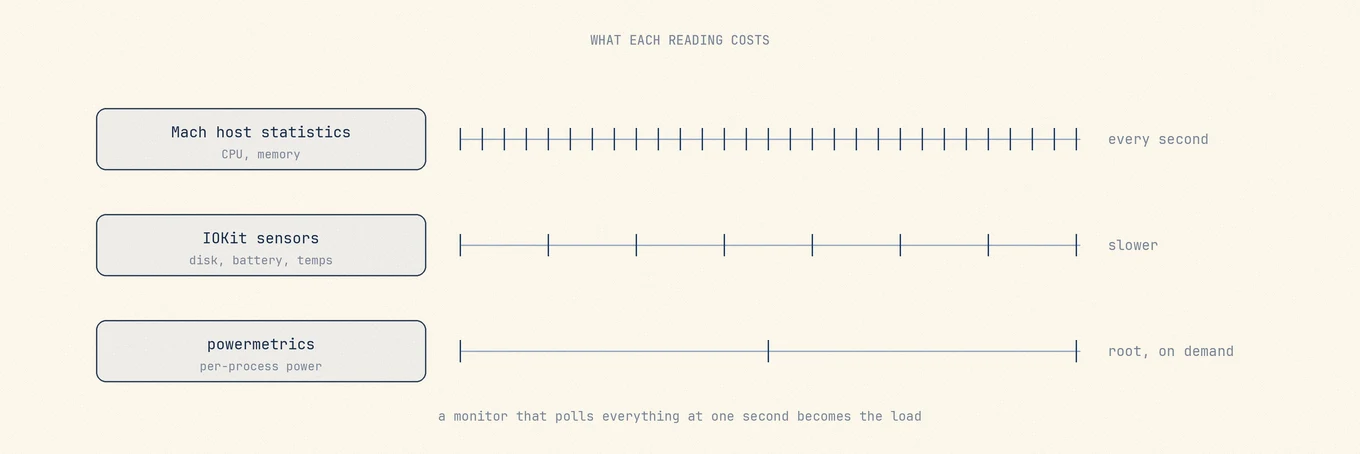
A few figures are not free to obtain. Per-process power attribution and fine-grained GPU
power detail come from `powermetrics`, which requires root, so a monitor showing those
either asks for an administrator password, installs a privileged helper, or estimates
from something cheaper. Worth asking about before you install anything.
**A one-second poll is not free.** Each tick wakes the process and may trigger a redraw.
Simple counters are cheap, but enumerating every process, sweeping sensors, querying
drive health, and collecting GPU statistics cost more. Running all of them on one
cadence can make the monitor a measurable part of an otherwise idle laptop's load.
Careful implementations sample in tiers: inexpensive counters frequently, expensive
probes on a slower schedule or from a cache.
**Free memory is the wrong number to display, and some monitors still lead with it.**
macOS deliberately fills unused RAM with file cache and releases it the instant a
program needs the space, so a low free-memory figure is the system working correctly.
The honest indicator is memory pressure. A readout built around free gigabytes trains
you to worry on a schedule that has nothing to do with your Mac.
**Sensor coverage is a property of the machine, not the app.** The set of temperature,
fan, voltage, and power sensors a Mac publishes varies by model and generation. Apple
Silicon exposes a different set than late Intel Macs, and a fanless MacBook Air reports
no fan speed because there is no fan. No monitor can show a sensor the hardware does not
expose, and when two disagree about which sensors exist, the usual cause is a naming
table rather than one being more capable.
**Stored history is the real differentiator.** A live value is the common baseline.
Keeping samples adds a store, a retention policy, and background writes that must not
themselves become the load.
Simple counters and full sensor or process sweeps have different costs. A tiered cadence keeps the monitor from becoming a meaningful part of an idle machine's load.
## The choices
### Activity Monitor, already installed
Apple's [Activity Monitor](https://support.apple.com/guide/activity-monitor/welcome/mac)
covers CPU, memory, energy, disk, network, and cache activity, and can show CPU activity
as a live graph in the Dock. It is the authoritative view of processes on the machine,
and its inspector, sample, and open-files detail go deeper than most menu bar tools
attempt. Its weakness is that it is a window, not a glance, so you usually open it after
the interesting moment. For a Mac that misbehaves a few times a year, that is enough.
### Stats, the open-source default
[Stats](https://github.com/exelban/stats) is an MIT-licensed menu bar monitor with
modules for CPU, GPU, memory, disk, network, battery, sensors, Bluetooth devices, and a
multi-timezone clock, plus a legacy fan control mode. It supports macOS 12 and newer and
installs by download or `brew install stats`.
Maintenance is easy to verify rather than assume: releases and commits land
continuously, including fixes for the newest Apple Silicon chips. Its documentation does
not describe long-term history storage, so treat it as a readout. For most people asking
which menu bar monitor to get, this is the correct first answer.
### iStat Menus, the long-history choice
[iStat Menus](https://bjango.com/mac/istatmenus/) from Bjango is the deepest of the
group. Its listed coverage includes per-core CPU usage with history graphs, load
averages, uptime and frequency, memory usage with pressure, compressed memory and swap,
disk space and activity with S.M.A.R.T. status, network bandwidth with a breakdown of
the top apps, sensors for temperatures, fans, frequencies and voltages, battery state
including AirPods and Magic accessory levels, plus weather and a configurable clock.
Version 7.3 requires macOS 11 or later.
The history graphs and the per-app bandwidth breakdown are the reasons to choose it over
a free readout. It sells as a one-time purchase in single and family editions, with
discounted upgrades from the previous major version and a time-limited trial, and is
also available through Setapp as part of a subscription bundle. Check the official page
for current terms. It does not clean, uninstall, or repair anything, and that focus is a
feature.
### MenuMeters, effectively retired
MenuMeters was the classic answer here for years and is no longer a live option. The
most widely used fork,
[yujitach/MenuMeters](https://github.com/yujitach/MenuMeters), is GPL-2.0 and describes
support through Big Sur. Its last release was in November 2021, its last commit in March
2022, and its own README now points readers toward actively maintained alternatives,
naming Stats among them. Other forks exist, but none has taken over as the maintained
successor. If you find MenuMeters recommended in an older thread, that recommendation
has expired.
### Sensei, hardware dashboard with cleanup attached
[Sensei](https://cindori.com/sensei) from Cindori presents hardware and health
information rather than a minimal readout: CPU, GPU and battery statistics, thermal and
fan data, S.M.A.R.T. drive health, battery cycle counts, a disk speed benchmark, an SSD
Trim control, and a customizable status bar monitor, alongside cleanup and uninstall
features. Its [store page](https://cindori.com/store/sensei) offers both an annual
subscription and a one-time license, each valid for up to three Macs.
Consider it when drive and battery health context is the main attraction and cleanup is
a bonus. The page states no macOS version floor, so verify compatibility before buying.
### Mole, monitoring inside a maintenance app
[Mole](https://mole.fit/)'s Status tab is a bento grid of about nine tiles, health score, CPU, memory,
GPU, disk I/O, network, battery, thermal and fans, and uptime, each carrying a
60-second sparkline, above a process list that refreshes every second with sortable
name, PID, CPU, power, and memory columns, pinning, and a right-click to terminate or
copy the executable path. The menu bar HUD shows live CPU, memory, and network speed, or
a compact icon, and its popover carries the health hero, hardware tiles, and the top
five CPU processes, all reading one shared snapshot rather than sampling three times.
The boundary is explicit: 60 seconds of sparkline is not stored history, so it answers
"what is happening now" and not "what happened last Tuesday". If backwards-looking
questions are your reason for buying a monitor, buy one that keeps a record.
Its license is a one-time purchase with lifetime updates for two Macs on macOS 14 or
later, monitoring and scanning are free to use, and there is no telemetry. A free
open-source CLI covers the same ground with `mo status` and `mo status --json`.
## Quick comparison
| Tool | What it samples | Stored history | Licensing model |
| --- | --- | --- | --- |
| Activity Monitor | CPU, memory, energy, disk, network, cache | Live only | Included with macOS |
| Stats | CPU, GPU, memory, disk, network, battery, sensors, Bluetooth | Not documented | MIT open source |
| iStat Menus | The above plus S.M.A.R.T., per-app bandwidth, weather | Yes, history graphs | One-time, single or family |
| MenuMeters | CPU, memory, disk, network | No | GPL-2.0, unmaintained since 2022 |
| Sensei | Hardware, thermals, battery and drive health, benchmarks | Check official page | Subscription or one-time, up to 3 Macs |
| Mole | CPU, GPU, memory, disk I/O, network, battery, thermal, processes | 60-second sparklines | One-time, two Macs |
## A repeatable way to use a monitor
Write down the question you keep asking. If it is "what is eating the CPU right now",
Activity Monitor or a free readout closes it. If it is "what happened while I was away",
you need stored history and only some of these keep it. If it is "is this drive or
battery degrading", you want health reporting rather than a live graph. Buying above
your question produces an app you glance at and never act on.
Then check the cost of the monitor itself. Watch its own CPU use for a minute on
battery, and turn off modules you do not read.
Finally, stop at the handoff. A monitor's job ends the moment it names the saturated
resource; the fix lives in the workload, the app, the storage, or the airflow. That
handoff is the subject of [diagnosing a slow Mac](https://mole.fit/blog/why-is-my-mac-so-slow), and if
the reading that worries you is a temperature,
[checking Mac temperature](https://mole.fit/blog/how-to-check-mac-temperature) covers what the number
does and does not mean.
---
Canonical HTML page: https://mole.fit/blog/istat-menus-alternative
Blog index for agents: https://mole.fit/blog/llms.txt
Site index for agents: https://mole.fit/llms.txt