# Find and Remove Large Files on Mac Safely
> Interpret APFS snapshots, clones, and purgeable capacity, then classify large files by ownership and recoverability before removal.
Published: 2026-06-07 | Updated: 2026-08-22
The fastest way to find what is using a disk is to measure it, not to browse Finder
folder by folder. Measurement still needs interpretation: a 40 GB Photos library is
not equivalent to a 40 GB installer, and APFS snapshots, clones, and purgeable capacity
can make two correct tools report different-looking totals.
Here is how disk space is accounted for, how to measure it, and how to find the
large items safely.
## Why your disk is full but the files don't add up
Modern Macs use the APFS file system, and APFS reports space differently from
what Finder shows. Two categories hide gigabytes:
- **Local snapshots.** Time Machine keeps point-in-time snapshots of your disk on
the internal drive between backups. They pin the space of files you have
already deleted, because the snapshot still references them, until macOS thins
them. Apple says hourly snapshots are normally retained for about 24 hours and
[removed automatically](https://support.apple.com/102154) as they age or as space
is needed. List them with:
```
tmutil listlocalsnapshots /
```
- **Purgeable space.** APFS marks caches, local snapshots, and re-downloadable
content as purgeable: space macOS reclaims on its own when something needs it.
macOS can count this as available, and Finder may include it in the available
total. You cannot reliably clear it by hand.
Check the numbers with:
```
df -h /
diskutil apfs list
diskutil apfs listSnapshots /
```
`df` reports what the mounted file system considers used and available;
`diskutil apfs list` shows the shared container, its volumes, and remaining
capacity; `diskutil apfs listSnapshots /` lists snapshots attached to the startup
volume. When Finder says the disk is fuller than your files explain, these views
help separate ordinary file usage from snapshots and shared APFS capacity.
## Measure real usage from the command line
To find the heavy folders, `du` (disk usage) is the core tool. From your home
folder:
```
du -sh ~/* ~/Library 2>/dev/null | sort -h
```
`-s` gives a summary per item, `-h` prints human-readable sizes, and piping to
`sort -h` puts the biggest last. Drill into one large result at a time. Terminal may
need Full Disk Access for protected app data, and a home-folder scan can take a long
time when it crosses cloud folders or developer trees.
The number is not always physical allocation. Hard links give multiple names to the
same underlying file, and APFS clones share blocks until one copy changes. Folder
totals and container free space can therefore answer different questions. Use `du` to
locate candidates, then use Finder's Get Info and the APFS capacity view before making
a high-impact deletion.
To find individual large files instead of folders, `find` filters by size:
```
find ~/Downloads ~/Movies ~/Desktop -type f -size +500M -print 2>/dev/null
```
Start with user-controlled folders instead of scanning the entire home directory. The
command catches forgotten video exports, disk images, and archives without wandering
through every application database. Expand the list of roots only when necessary.
For an interactive terminal map, `ncdu` can browse a selected folder by size. Treat it
as a read-only discovery tool first; reveal a candidate in Finder and move it to Trash
after identifying it rather than deleting from an unfamiliar tree inside `ncdu`.
## Reclaim the hidden space
If snapshots or purgeable space are the problem rather than a single file,
freeing real user-controlled space gives macOS room while it ages or thins local
snapshots and purgeable caches automatically. Reconnecting a Time Machine disk makes
more backup history available, but it is not a manual snapshot-purge command. You
rarely need to force either category by hand.
## A visual map, when a list is not enough
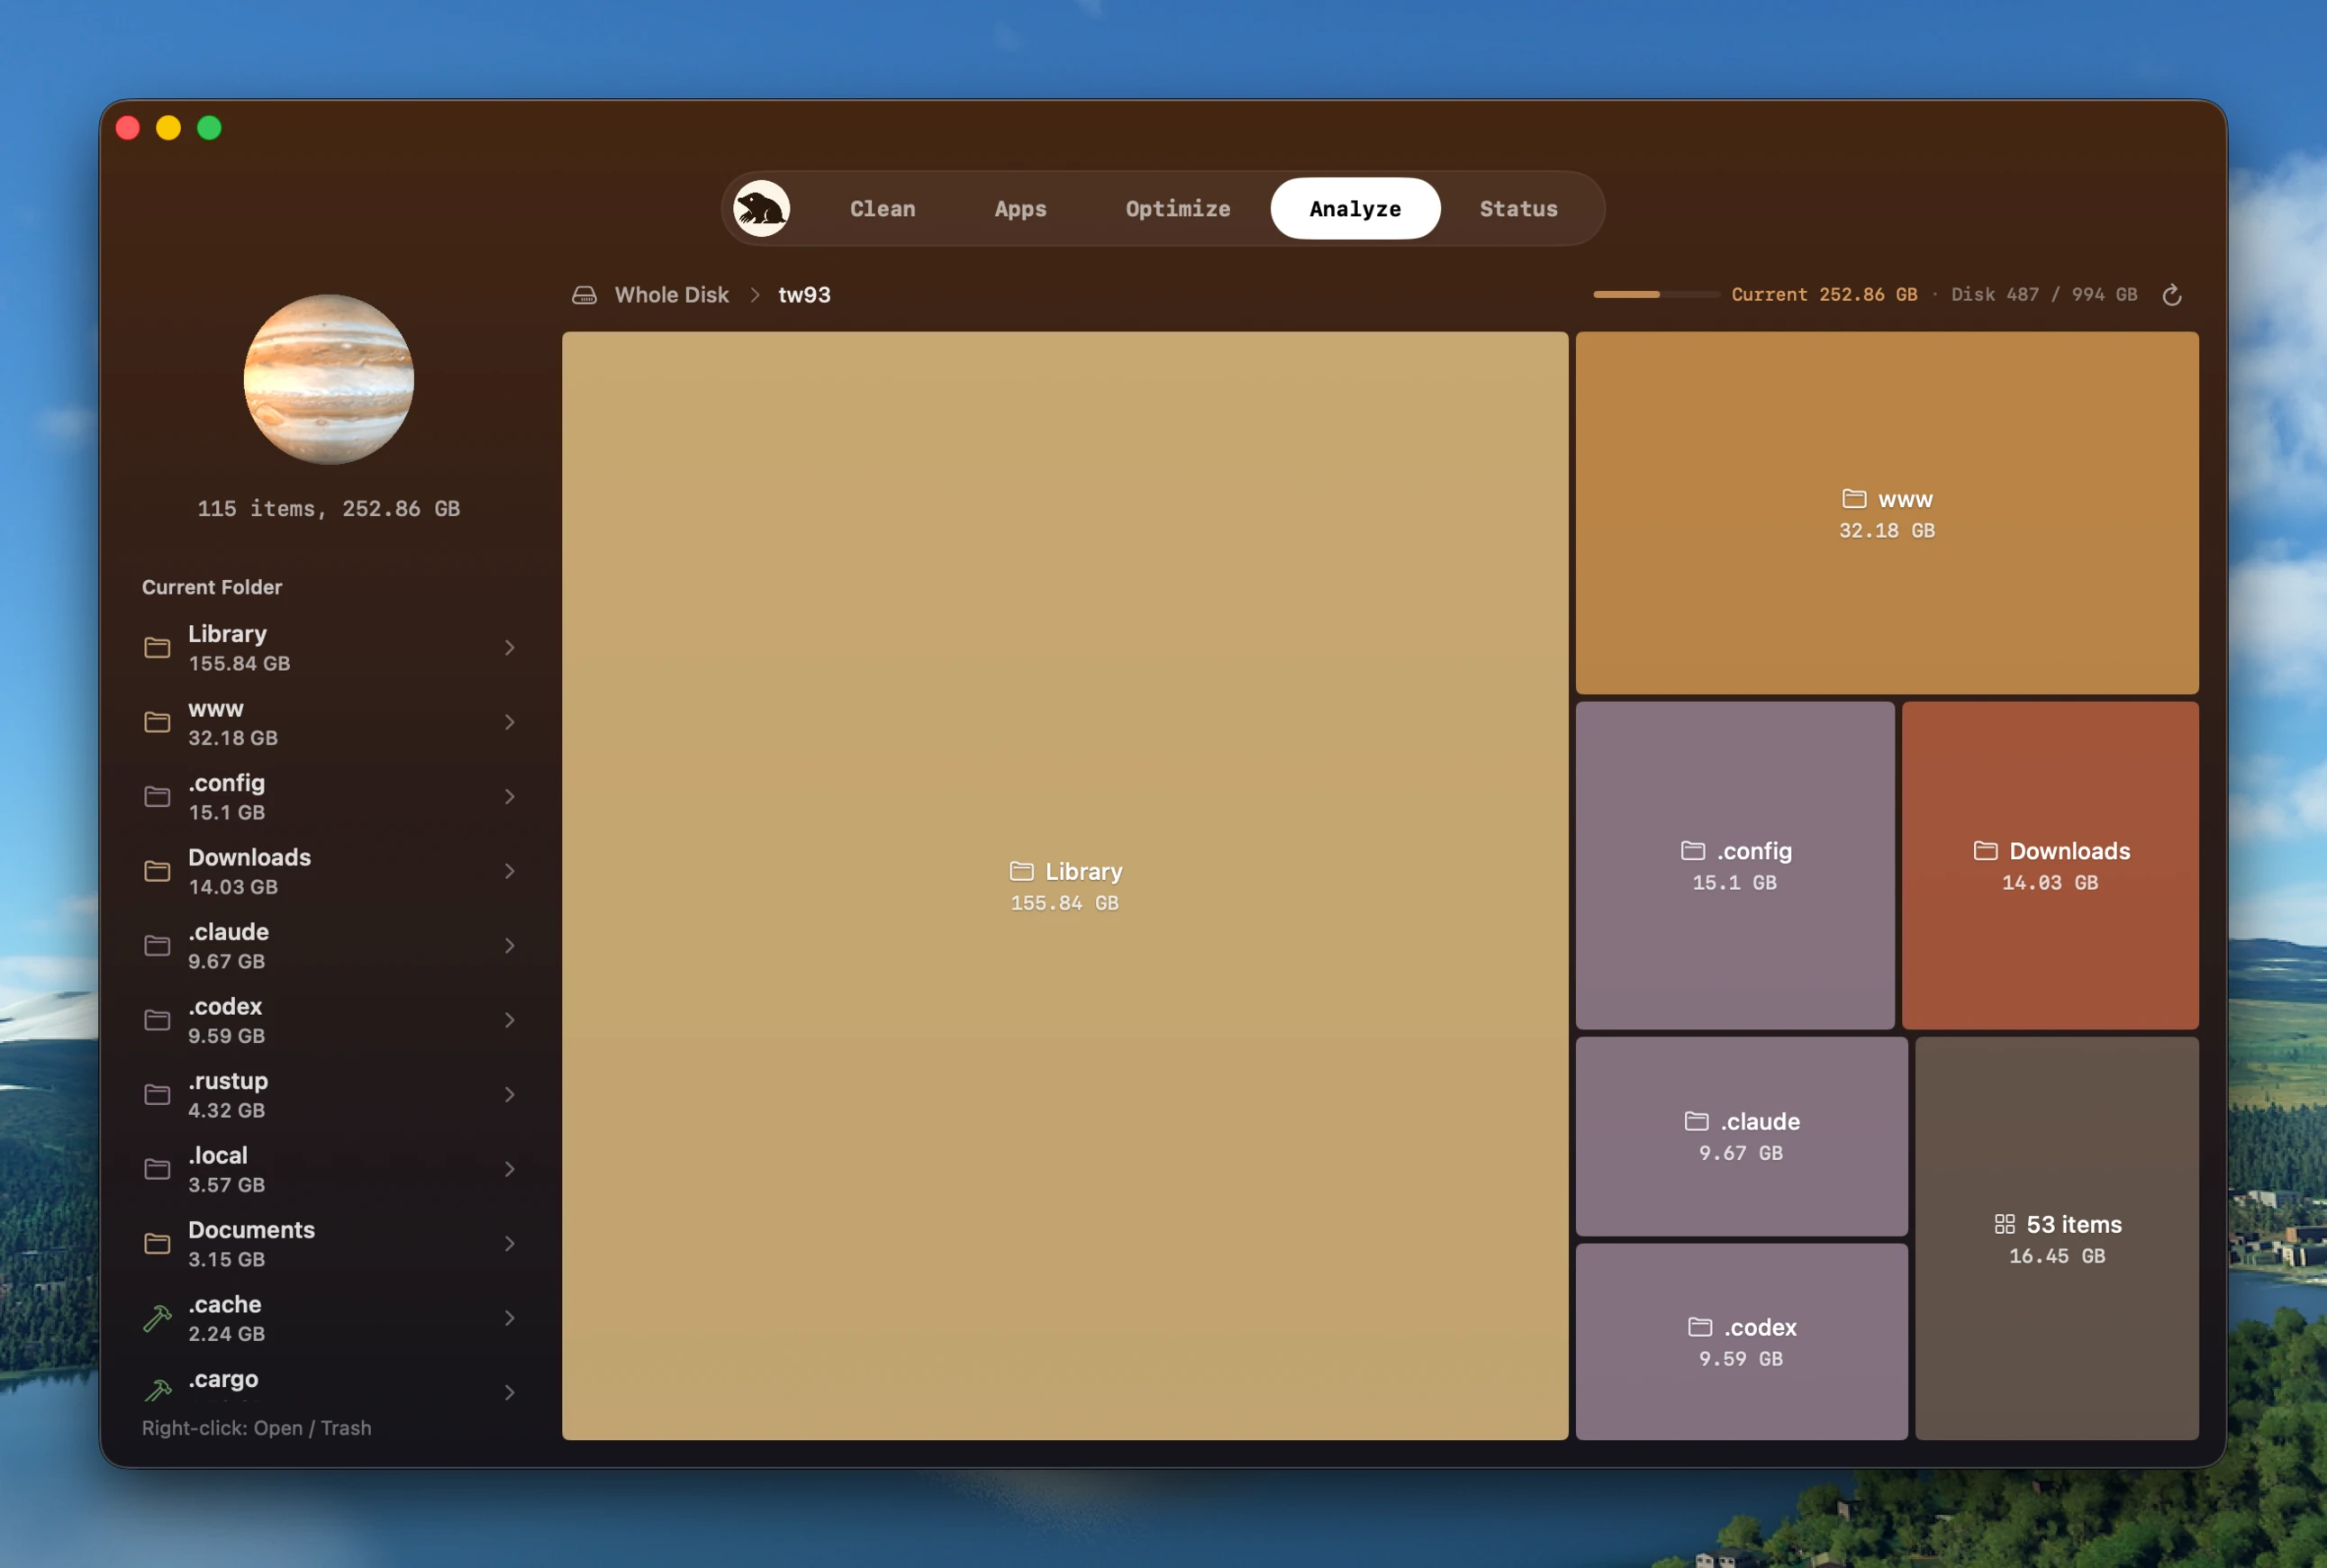
A treemap of the whole disk: the largest folders are the largest blocks, and a click drills into any of them. This is Mole's Analyze view.
Sizes in a terminal are useful but hard to hold in your head across a whole disk.
A treemap solves that by drawing every folder as a rectangle scaled to its size,
so the largest things are the largest blocks and one glance shows where the weight
sits. [Mole](https://mole.fit/)'s Analyze view is a graphical counterpart to the path-level walk
above: it maps the whole disk from the root, drills in on a click, and lets you
reveal an item in Finder or send it to the Trash (from the right-click menu, with a
size confirmation, and recoverable until Trash is emptied). Navigational roots
like your home folder have no delete option, so a misclick cannot remove something
structural. Use whichever you prefer; the treemap and the commands answer the same
question.
## Under the hood: how a disk analyzer stays fast
You do not need this part to free up space, but if you have ever wondered why a
good disk map returns in seconds where a naive script crawls, here is the shape of
it. The example is [Mole's open-source command-line tool](https://github.com/tw93/Mole),
specifically its Go analyzer in `cmd/analyze`. The native app has a separate Swift
scanner, but both keep concurrency bounded and deduplicate hard links.
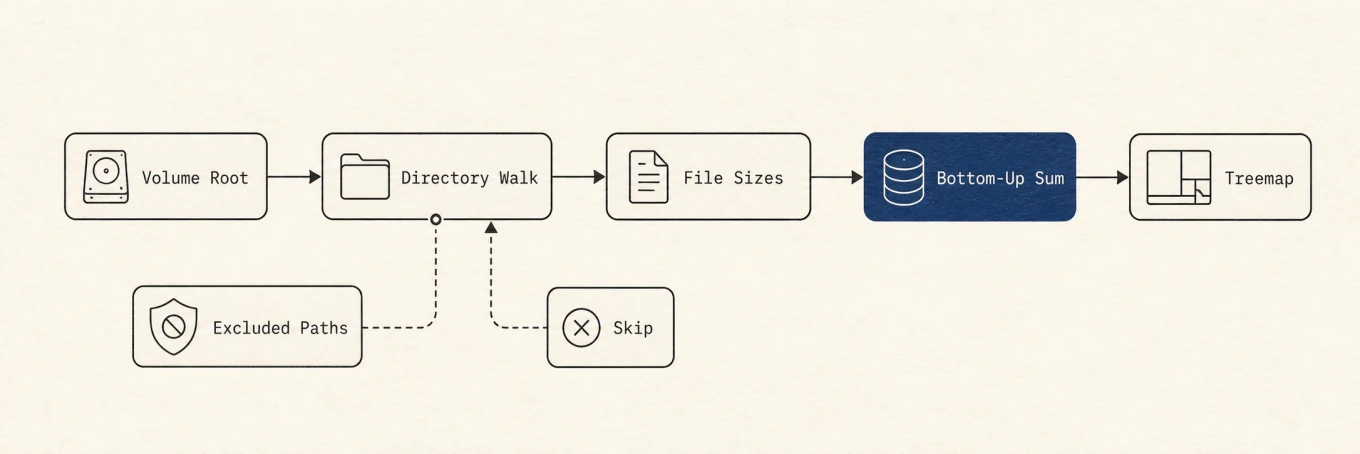
In the CLI analyzer, the queue bounds pending work, separate budgets cap directory walkers and du processes, hard-link dedup counts each byte once, and Top-N heaps avoid sorting the whole tree.
The slow way is the obvious one: walk every folder, `stat` every file, add it all
up, then sort. On a home directory with millions of small files that is both slow
and memory-hungry. The scanner avoids both traps with three ideas.
**Bounded, but not with a single limit.** Naive parallelism spawns a goroutine per
folder and melts the disk. The scanner keeps separate budgets for separate
resources instead: a pool of directory workers (2 to 12, scaled to your cores), a
much smaller pool of at most four concurrent `du` subprocesses (because `du` is
already I/O-parallel, and running more of them only makes the disk thrash), and a
queue bound so pending work never balloons into thousands of stacked goroutines.
Collapsing those into one limit is how disk tools end up either slow or
memory-hungry.
**Keep only the winners.** You want the biggest folders, not all of them, so the
scanner never sorts the whole disk. It streams every measured item through two
min-heaps, one holding the Top 30 folders and one the Top 20 files. When a heap is
full, a new item is compared against the smallest survivor and dropped if it does
not beat it. That is roughly linear in the number of files and holds only a few
dozen entries in memory, instead of sorting millions.
**Count each byte once.** A file with several hard links would otherwise be added
once per link. The scanner records each file's `(device, inode)` pair the first
time it sees it and skips the repeats, which is how its totals match `du`. It even
refuses to cache a folder total that depended on this dedup, because that number is
scan-order dependent and would poison a later standalone re-scan.
None of this is exotic. It is the difference between a tool that answers "what is
filling my disk" in seconds and a shell loop that does not, and the treemap above
is the front end of exactly this engine.
## Classify before removing anything
Finding a large item is not permission to delete it. Put each candidate into one of
three buckets:
- **Replaceable:** verified installers, reproducible build output, and documented
caches. Check the cost of downloading or rebuilding them before removal.
- **Personal or operational:** photos, messages, project archives, virtual-machine
disks, model weights, and device backups. Export, back up, or retire these through
the owning app.
- **App-managed or system-managed:** package databases, containers, Photos or Mail
libraries, snapshots, and anything under `/System`. Use the app's controls or leave
it alone.
If a large folder belongs to an app you no longer use, follow its documented
uninstaller and then [review its leftovers](https://mole.fit/blog/how-to-completely-uninstall-apps-on-mac).
Move ordinary files to Trash first and keep them there until the affected app and
project still work. Emptying Trash is the irreversible step.
For the wider cleanup beyond single large files, see
[how to free up space without losing files](https://mole.fit/blog/how-to-free-up-space-on-mac).
## A repeatable method
First compare `df`, APFS capacity, and Storage settings so you know whether the problem
is real physical pressure or classification. Next measure selected roots, drill into
the largest branch, and classify the candidate by ownership and recoverability. Remove
replaceable data first, handle personal data through backups and owning apps, and keep
ordinary deletions recoverable in Trash until you have verified the result.
---
Canonical HTML page: https://mole.fit/blog/how-to-find-large-files-on-mac
Blog index for agents: https://mole.fit/blog/llms.txt
Site index for agents: https://mole.fit/llms.txt